Technical Analysis for Crypto Trading
TA (technical analysis) is a crucial skill for cryptocurrency traders, helping identify potential price movements through chart patterns, indicators, and market psychology. This comprehensive guide covers essential TA concepts specifically adapted for the volatile crypto markets of 2025.
Introduction
Technical analysis has become an indispensable tool for cryptocurrency traders seeking to navigate the volatile and often unpredictable digital asset markets. Unlike traditional financial markets that operate within established frameworks and regulatory structures, cryptocurrency markets present unique challenges and opportunities that require specialised analytical approaches and a deep understanding of market psychology.
Cryptocurrency markets operate 24/7 with extreme volatility. This makes technical analysis both challenging and rewarding. Fundamental analysis examines the utility of blockchain projects. Technical analysis focuses on price patterns, volume, and momentum. These insights work regardless of the underlying technology.
Technical analysis studies price charts and trading volumes. It identifies patterns that predict future movements. The core premise is simple. All information is reflected in the price. Price movements follow identifiable patterns. These patterns repeat due to human psychology.
Crypto markets have smaller capitalisation than traditional assets. Technical patterns play out more dramatically. Signals are often clearer. However, cryptocurrency markets face the risk of manipulation. Sudden sentiment shifts can invalidate predictions. Traders must account for this volatility.
Modern crypto analysis combines traditional charting with new methods. On-chain analysis tracks blockchain transactions. Social sentiment indicators measure market mood. Cross-market correlation studies reveal connections. These tools provide insights beyond price and volume. DeFi protocols and smart contracts add complexity. Token economics influence price behaviour.
Success requires understanding tools and techniques. Discipline is essential for systematic trading. Emotional control matters in volatile markets. This guide covers concepts, tools, and strategies. It provides foundations and practical applications. Content suits traders at all levels.
Cryptocurrency markets evolved rapidly. Sophisticated platforms emerged for digital asset trading. These integrate traditional indicators with blockchain metrics. Traders access comprehensive analytical capabilities. Exchange data, wallet movements, and gas fees provide signals. Protocol governance and tokenomics affect prices.
Psychology drives cryptocurrency trading patterns. FOMO creates buying pressure. Panic triggers selling waves. Euphoria inflates bubbles. Skilled analysts identify these patterns. They exploit them for profitable opportunities. Understanding market psychology is crucial.
This guide covers the complete journey. Start with basic chart reading. Learn pattern recognition. Progress to multi-timeframe analysis. Master risk management strategies. Professional traders use these methods. They profit consistently in volatile markets. Beginners and experienced traders benefit. This resource provides essential knowledge.
Modern cryptocurrency technical analysis combines traditional charting methods with innovative blockchain-specific metrics that provide comprehensive market insights. On-chain data analysis reveals wallet movements and transaction patterns. Exchange flow metrics indicate institutional activity. Network fundamentals like hash rate and active addresses confirm trend strength. Social sentiment indicators measure market psychology. These additional data points enhance traditional technical analysis accuracy significantly.
The cryptocurrency market structure differs fundamentally from traditional financial markets. Twenty-four-hour trading creates continuous price discovery. Global participation ensures constant liquidity. Decentralised exchanges operate alongside centralised platforms. Cross-chain bridges enable asset movement. Layer-two solutions reduce transaction costs. These structural characteristics create unique technical patterns. Understanding these differences improves analytical accuracy. Successful traders adapt traditional methods accordingly.
Risk management becomes paramount in volatile cryptocurrency markets. Position sizing protects capital during drawdowns. Stop-loss orders limit potential losses. Take-profit targets secure gains systematically. Portfolio diversification reduces concentration risk. Regular performance reviews identify improvement areas. Emotional discipline maintains trading consistency. These principles separate successful traders from unsuccessful ones consistently over time.
Understanding TA Fundamentals
What is Technical Analysis?
TA is the study of price movements and trading volume to predict future price direction. Unlike fundamental analysis, which examines underlying value, TA focuses purely on price action and market behaviour.
Core principles of TA:
- Price discounts everything - all information is reflected in price
- Price moves in trends that can be identified and followed
- History tends to repeat itself through recognisable patterns
- Market psychology drives predictable behaviour patterns
Why TA Works in Crypto
Cryptocurrency markets are particularly well-suited for chart analysis due to their 24/7 nature, high volatility, and strong retail participation. The emotional nature of crypto trading creates clear patterns that TA can identify.
Crypto-specific advantages:
- High volatility creates clear price patterns
- 24/7 markets provide continuous data
- Strong retail participation amplifies emotional patterns
- Limited fundamental data makes TA more relevant
- Social media sentiment creates predictable reactions
Essential Chart Types and Timeframes
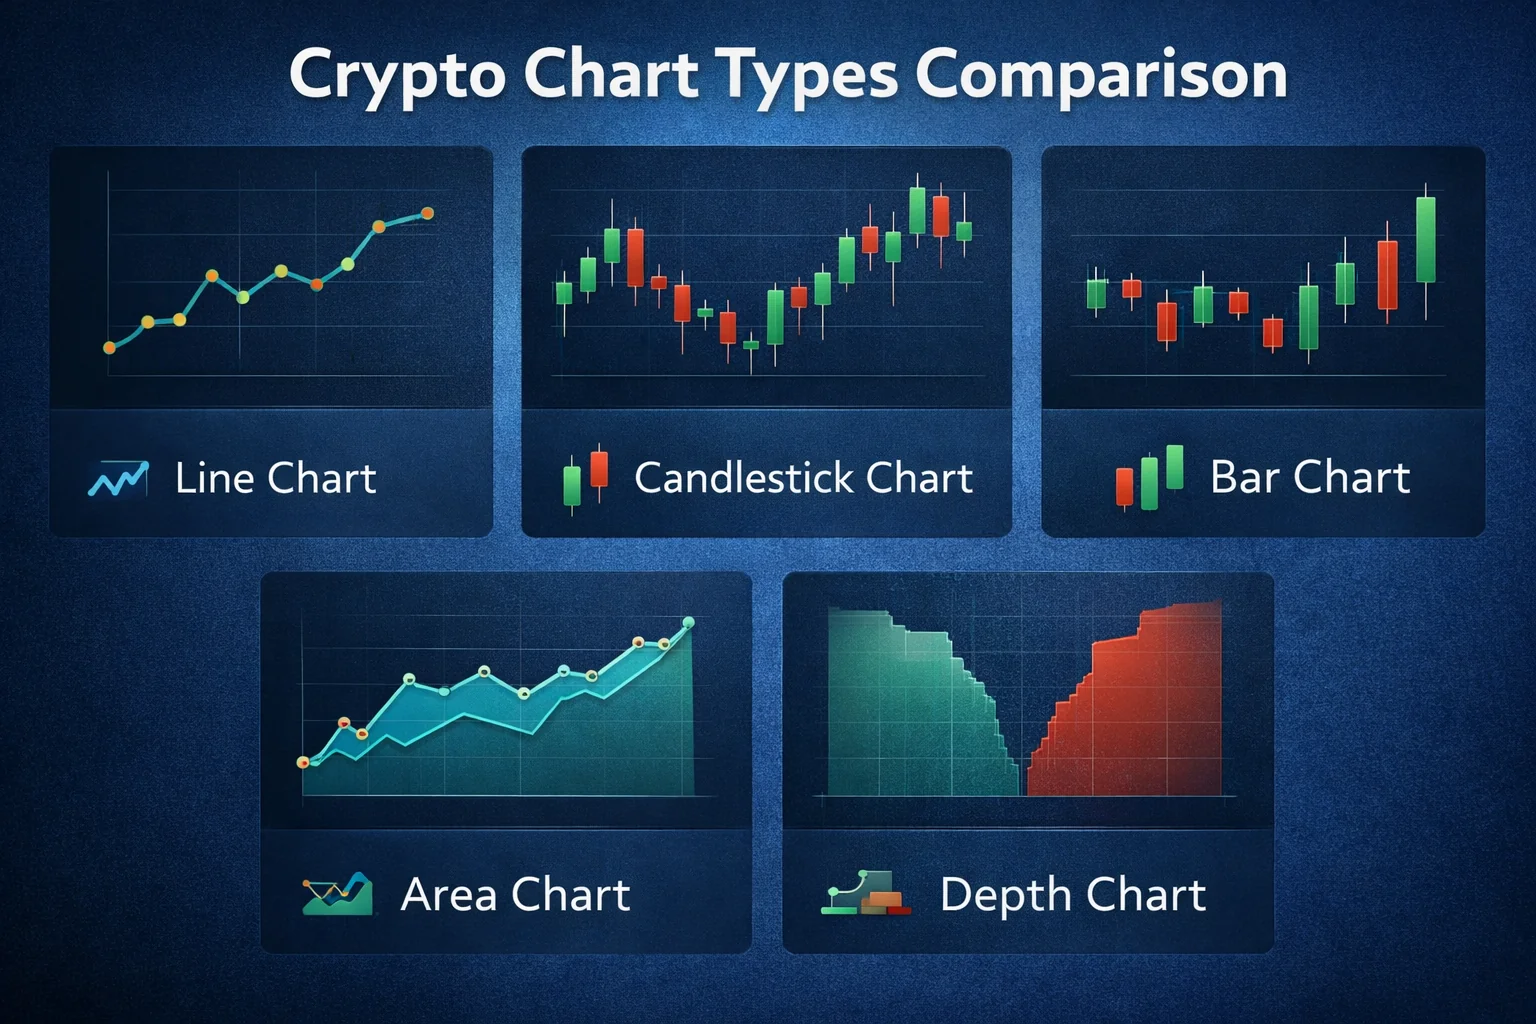
Candlestick Charts
Candlestick charts are the most popular choice for crypto trading, providing comprehensive information about price action within each time period.
Candlestick components:
- Body: Shows opening and closing prices
- Wicks/Shadows: Display highest and lowest prices
- Colour: Green/white for bullish, red/black for bearish
- Size: Indicates strength of price movement
Timeframe Selection
Different timeframes serve different trading strategies and provide varying levels of detail:
Short-term (1m - 15m):
- Day trading and scalping
- Entry and exit timing
- High noise, requires experience
Medium-term (1h - 4h):
- Swing trading strategies
- Trend confirmation
- Balanced signal quality
Long-term (1D - 1W):
- Position trading and investing
- Major trend identification
- Lower noise, clearer signals
Support and Resistance Levels
Identifying Key Levels
Support and resistance levels are fundamental concepts in chart analysis, representing price levels where buying or selling pressure historically emerges.
Support levels: Price floors where buying interest typically emerges
Resistance levels: Price ceilings where selling pressure typically increases
Methods to identify levels:
- Previous highs and lows
- Round psychological numbers (e.g., $50,000 for Bitcoin)
- Moving averages as dynamic levels
- Volume profile and high-volume nodes
- Fibonacci retracement levels
Trading Support and Resistance
Effective strategies for trading these levels:
- Buy near support with stop-loss below
- Sell near resistance with stop-loss above
- Wait for breakouts with volume confirmation
- Use multiple timeframes for confirmation
- Consider false breakouts and reversals
Essential Technical Indicators
Moving Averages
Moving averages smooth price data to identify trends and provide dynamic support/resistance levels.
Simple Moving Average (SMA): Average price over specified periods
Exponential Moving Average (EMA): Gives more weight to recent prices
Popular moving average strategies:
- Golden Cross: 50 EMA crosses above 200 EMA (bullish)
- Death Cross: 50 EMA crosses below 200 EMA (bearish)
- Price above/below MA indicates trend direction
- MA slope shows trend strength
Relative Strength Index (RSI)
RSI measures the speed and magnitude of price changes, helping identify overbought and oversold conditions.
RSI interpretation:
- Above 70: Potentially overbought (sell signal)
- Below 30: Potentially oversold (buy signal)
- Divergences: Price and RSI moving in opposite directions
- Centerline (50): Trend strength indicator
MACD (Moving Average Convergence Divergence)
MACD illustrates the relationship between two moving averages, helping to identify trend changes and momentum.
MACD components:
- MACD Line: 12 EMA minus 26 EMA
- Signal Line: 9 EMA of MACD line
- Histogram: Difference between MACD and signal lines
MACD signals:
- MACD crosses above signal line: Bullish
- MACD crosses below signal line: Bearish
- Histogram expansion: Increasing momentum
- Centerline crosses: Trend confirmation
Bollinger Bands
Bollinger Bands consist of a moving average with upper and lower bands based on standard deviation, helping identify volatility and potential reversal points.
Bollinger Band strategies:
- Price touching upper band: Potential sell signal
- Price touching lower band: Potential buy signal
- Band squeeze: Low volatility, potential breakout
- Band expansion: High volatility period
Chart Patterns
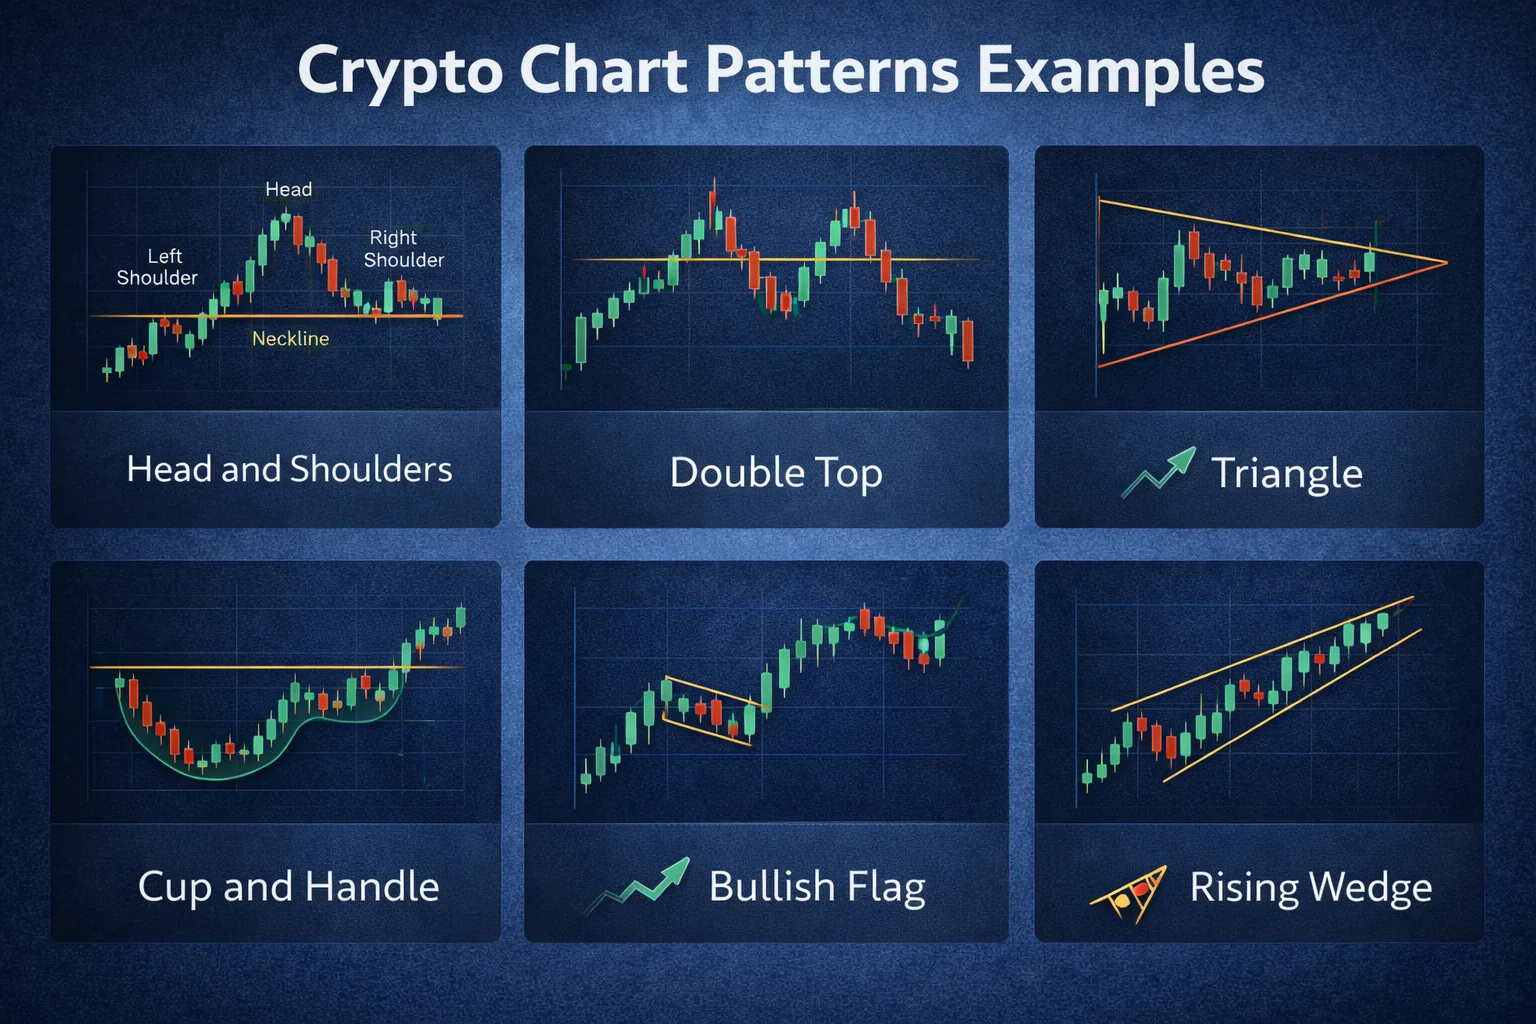
Reversal Patterns
Head and Shoulders: Bearish reversal pattern with three peaks, middle peak highest
Inverse Head and Shoulders: Bullish reversal pattern with three troughs
Double Top/Bottom: Two similar highs/lows indicating potential reversal
Trading reversal patterns:
- Wait for neckline break confirmation
- Measure target using pattern height
- Use volume to confirm pattern validity
- Place stop-loss beyond pattern extremes
Continuation Patterns
Triangles: Ascending, descending, and symmetrical triangles
Flags and Pennants: Brief consolidation after strong moves
Rectangles: Horizontal consolidation ranges
Continuation pattern characteristics:
- Temporary pause in existing trend
- Volume typically decreases during formation
- Breakout direction usually follows prior trend
- Volume should increase on breakout
Volume Analysis
Volume Indicators
Volume provides crucial confirmation for price movements and helps validate technical signals. According to TradingView's volume analysis documentation, volume should always be considered alongside price action for complete market analysis.
On-Balance Volume (OBV): Cumulative volume indicator showing buying/selling pressure
Volume Profile: Shows volume distribution at different price levels
Accumulation/Distribution Line: Combines price and volume to show money flow
Volume Patterns
Key volume patterns to watch:
- Volume spikes during breakouts confirm moves
- Declining volume in trends suggests weakening
- High volume at support/resistance increases significance
- Volume divergences can signal trend changes
Fibonacci Analysis
Fibonacci Retracements
Fibonacci retracements help identify potential support and resistance levels based on mathematical ratios found in nature. As explained in Investopedia's Fibonacci retracement guide, these levels are widely used by traders to identify potential reversal points.
Key Fibonacci levels:
- 23.6% - Shallow retracement
- 38.2% - Common retracement level
- 50% - Psychological midpoint
- 61.8% - Golden ratio, strong level
- 78.6% - Deep retracement
Fibonacci Extensions
Extensions help identify potential profit targets beyond the original move:
- 127.2% - First extension target
- 161.8% - Golden ratio extension
- 261.8% - Strong extension level
Crypto-Specific Considerations
Market Structure Differences
Cryptocurrency markets have unique characteristics that affect TA:
- 24/7 trading creates gaps less frequently
- Weekend trading can create unique patterns
- Lower liquidity in some altcoins increases volatility
- Correlation between different cryptocurrencies
- Bitcoin dominance affects altcoin movements
Social Sentiment Integration
Crypto markets are heavily influenced by social media and news, creating additional analysis opportunities:
- Twitter sentiment indicators
- Reddit discussion volume
- Google Trends correlation
- Fear and Greed Index
- Whale movement tracking
Risk Management in Technical Trading
Risk management is the foundation of successful trading. According to Investopedia's risk management guide, proper risk control is what separates professional traders from gamblers. Without disciplined risk management, even the best TA becomes worthless.
Position Sizing
Proper position sizing is crucial for long-term success in crypto trading. The goal is to survive losing streaks while maximising gains during winning periods. Professional traders never risk more than they can afford to lose on any single trade.
- Risk only 1-2% of capital per trade
- Use stop-losses to limit downside
- Scale position size based on confidence level
- Consider volatility when sizing positions
- Diversify across multiple setups
For example, with a $10,000 account and 2% risk per trade, you would risk $200 maximum. If your stop-loss is 10% away from entry, your position size should be $2,000 (10% of $2,000 = $200 risk).
Stop-Loss Strategies
Effective stop-loss placement techniques:
- Below support levels for long positions
- Above resistance levels for short positions
- Beyond pattern boundaries
- Based on Average True Range (ATR)
- Trailing stops to lock in profits
Building a Trading System
System Components
A complete trading system should include:
- Market analysis methodology
- Entry and exit criteria
- Risk management rules
- Position sizing guidelines
- Performance tracking methods
Backtesting and optimisation
Test your system before risking real money:
- Use historical data to test strategies
- Paper trade in real-time conditions
- Track all trades and analyse results
- optimise parameters based on performance
- Account for transaction costs and slippage
Common Mistakes to Avoid
Analysis Pitfalls
Even experienced traders fall into these TA traps. Understanding these mistakes helps you avoid costly errors and improve your trading performance over time.
- Over-relying on single indicators - No indicator is perfect; always use multiple confirmations
- Ignoring volume confirmation - Price moves without volume are often false signals
- Drawing patterns that don't exist - Confirmation bias leads to seeing patterns everywhere
- Changing analysis to fit desired outcome - Stick to your original analysis plan
- Not considering multiple timeframes - What looks bullish on 1H might be bearish on 1D
The most dangerous mistake is retrofitting your analysis after the fact. It's easy to explain price movements in hindsight, but profitable trading requires predicting future movements. Always document your analysis before entering trades to avoid this bias.
Emotional Trading Errors
Psychological mistakes that undermine chart analysis are often more damaging than analytical errors. Your mindset determines whether you can execute your strategy consistently.
- FOMO (Fear of Missing Out) entries - Chasing pumps usually results in buying tops
- Revenge trading after losses - Emotional trading leads to bigger losses
- Moving stop-losses against you - This turns small losses into large ones
- Overtrading based on minor signals - Quality over quantity in trade selection
- Ignoring risk management rules - One bad trade shouldn't wipe out weeks of gains
Successful traders treat trading as a business, not gambling. They follow their system even when emotions scream to do otherwise. Keeping a trading journal helps identify emotional patterns and improve discipline over time.
Advanced Techniques
Multi-Timeframe Analysis
Professional traders use multiple timeframes to get a complete picture of market conditions. This approach helps identify the overall trend while finding optimal entry and exit points.
Use multiple timeframes for better trade timing:
- Higher timeframe for trend direction - Use daily or weekly charts to identify the primary trend
- Lower timeframe for precise entries - Use 1H or 4H charts to time your entries within the trend
- Confirm signals across timeframes - A bullish signal on 1H is stronger if 1D is also bullish
- Use longer timeframes for stop placement - Stops based on daily levels are less likely to be hit by noise
A common approach is the "top-down" method: start with monthly charts to identify the macro trend, move to weekly for intermediate trends, daily for swing trades, and hourly for precise entries. This ensures you're trading with the trend across all relevant timeframes.
Intermarket Analysis
Cryptocurrency markets don't exist in isolation. Understanding relationships between different assets helps predict movements and identify opportunities.
Consider relationships between different markets:
- Bitcoin's influence on altcoins - When BTC moves strongly, altcoins often follow or consolidate
- Traditional market correlations - Stock market trends can influence crypto sentiment
- DeFi token relationships - Tokens in the same sector often move together
- Sector rotation patterns - Money flows between different crypto sectors in cycles
For example, during Bitcoin rallies, altcoins often underperform initially as traders move capital into BTC. Once Bitcoin consolidates, capital typically rotates into altcoins, creating opportunities for those who understand these patterns.
Tools and Platforms
Charting Platforms
TradingView remains the most popular choice for crypto TA, offering comprehensive charting tools and social features.
Other popular platforms:
- Coinigy for multi-exchange analysis
- CryptoWatch for professional trading
- Exchange native charts for basic analysis
- Mobile apps for on-the-go analysis
Additional Tools
Supplementary analysis tools:
- On-chain analysis platforms
- Social sentiment trackers
- News aggregation services
- Economic calendar tools
- Portfolio tracking applications
Professional Implementation Strategies and Best Practices
Strategic Planning and Risk Assessment Framework
Technical analysts employ indicator diversification strategies across multiple analysis methods, timeframes, and confirmation signals to minimise false signal risks while maintaining trading accuracy. Regular indicator calibration, signal validation, and method optimisation ensure optimal analysis quality in volatile global cryptocurrency markets.
Advanced Security and Operational Excellence
Technical analysis security protocols include secure trading platform selection, proper risk management procedures, and comprehensive position monitoring systems that protect trading capital against market volatility and execution risks. Professional traders implement systematic security practices including secure API management and comprehensive backup procedures for trading strategies.
Market Intelligence and Competitive Analysis
Technical analysis in cryptocurrency markets involves chart pattern recognition, indicator interpretation, and trend analysis that identify optimal entry and exit points. Professional traders utilise multiple timeframe analysis, volume confirmation, and risk management principles to navigate volatile market conditions.
Technical analysis in cryptocurrency markets involves chart pattern recognition, indicator interpretation, and trend analysis to identify optimal entry and exit points. Successful technical analysis combines multiple timeframe analysis, volume confirmation, and risk management principles to navigate volatile crypto market conditions effectively.
Professional Technical Analysis and Institutional Trading
Institutional Analysis Methods
Professional cryptocurrency analysis uses advanced statistical models. Machine learning algorithms identify patterns. Systematic trading frameworks execute strategies. Institutional operations require quantitative analysis. Backtesting validates trading systems. Algorithmic trading leverages technical indicators. Risk management protects capital. Portfolio management spans multiple market conditions.
Institutional strategies analyse market microstructure. Order flow dynamics reveal trading pressure. Pattern recognition identifies opportunities. Signal validation confirms trades. Execution algorithms optimise performance. Professional traders manage market risks. Digital asset management adapts to conditions. Regulatory frameworks guide operations.
Quantitative analysis employs statistical models. Data analysis processes market information. Machine learning improves pattern recognition. Signal generation triggers trades. Backtesting systems verify strategies. Performance attribution tracks results. Optimisation procedures enhance efficiency. Risk management maintains consistency.
Advanced Pattern Recognition
Professional pattern recognition uses identification algorithms. Validation procedures confirm patterns. Trading frameworks execute strategies. Automated systems detect patterns. Signal filtering reduces false signals. Execution algorithms manage trades. Pattern-based trading requires discipline. Volatility management protects positions.
Systematic trading validates patterns statistically. Entry and exit procedures follow rules. Risk management techniques limit losses. Automated systems execute trades. Performance monitoring tracks results. Optimisation improves strategies. Regulatory compliance ensures legitimacy. Market conditions affect performance.
Pattern optimisation analyses reliability. Statistical validation confirms accuracy. Machine learning improves identification. Pattern databases store historical data. Validation procedures test patterns. Optimisation algorithms enhance performance. Risk management controls exposure. Multiple market cycles provide data.
Risk Management and Portfolio Integration
Professional risk management addresses signal reliability. Market volatility creates challenges. Systematic trading risks require controls. Risk assessment evaluates threats. Position sizing limits exposure. Hedging strategies protect capital. Performance optimisation balances risk and reward. Market conditions vary constantly.
Portfolio integration systematically allocates capital. Correlation analysis reveals relationships. Optimisation techniques balance strategies. Diversification reduces risk. Portfolio monitoring tracks performance. Rebalancing maintains targets. Performance attribution identifies sources. Operational efficiency matters for institutions.
Technology and Automation
Professional implementation requires technology integration. Automated signal generation identifies opportunities. Systematic execution follows rules. Performance monitoring tracks results. Security standards protect assets. API integration connects systems. Automated trading executes strategies. Analytics platforms provide insights. Security measures prevent breaches. Regulatory compliance ensures legitimacy.
Automation systems process signals efficiently. Execution algorithms manage trades. Monitoring capabilities track performance. Institutional standards guide operations. Quality control measures ensure accuracy. Performance monitoring identifies issues. Risk management controls exposure. Security standards protect data.
Market Structure and Liquidity
Professional analysis understands market microstructure. Order book dynamics show supply and demand. Liquidity patterns affect execution. Price action reflects market forces. Technical indicators measure conditions. Market depth reveals available liquidity. Order flow patterns indicate pressure. Liquidity distribution varies across exchanges.
Market structure analysis evaluates trading volumes. Bid-ask spreads indicate liquidity. Market maker behaviour affects prices. Pattern reliability depends on liquidity. Indicator performance varies by exchange. Market structure monitoring tracks conditions. Liquidity assessment guides execution. Optimisation reduces market impact. Execution costs affect profitability.
Cross-Asset Analysis
Advanced analysis examines cross-asset correlations. Cryptocurrency markets connect to traditional finance. Macroeconomic indicators influence prices. Pattern effectiveness varies by correlation. Signal reliability depends on the market regime. Correlation monitoring tracks relationships. Inter-market analysis reveals connections. Signal validation confirms patterns. Correlation risks require management.
Cross-market analysis evaluates Bitcoin dominance. Altcoin correlations affect strategies. Traditional markets influence crypto. Analysis effectiveness depends on relationships. Trading strategy performance varies. Correlation databases store historical data. Pattern validation spans multiple assets. Optimisation procedures enhance performance. Diversification reduces correlation risk.
Regulatory Compliance
Professional implementation requires regulatory compliance. Trading documentation records activities. Record-keeping maintains audit trails. Professional standards guide operations. Compliance monitoring tracks requirements. Documentation procedures ensure legitimacy. Regulatory frameworks vary by jurisdiction. Compliance systems automate processes.
Compliance frameworks address risk disclosure. Performance reporting tracks results. Professional standards ensure quality. Fiduciary responsibilities protect clients. Operational excellence maintains standards. Compliance systems manage requirements. Regulatory monitoring tracks changes. Documentation procedures record activities. Regulatory landscapes evolve constantly. Compliance requirements support operations.
Advanced Cryptocurrency Technical Analysis Strategies and Professional Trading Methodologies
Multi-Timeframe Analysis and Market Structure Understanding
Professional cryptocurrency technical analysis requires sophisticated multi-timeframe analysis that combines short-term price action with long-term market structure to identify high-probability trading opportunities and strategic investment positions. Multi-timeframe analysis includes systematic evaluation of weekly, daily, and intraday charts to understand market context, identify trend direction, and optimise entry and exit timing for cryptocurrency trading strategies that maximise profitability while minimising risk exposure.
Market structure analysis includes identification of key support and resistance levels across multiple timeframes, systematic evaluation of trend strength and momentum indicators, and comprehensive assessment of volume patterns that confirm price movements and validate trading signals. Professional market structure analysis includes understanding of institutional trading patterns, identification of accumulation and distribution phases, and strategic positioning based on market cycle analysis that enhances trading performance through systematic technical analysis excellence.
Advanced Pattern Recognition and Price Action Trading
Sophisticated cryptocurrency trading requires advanced pattern recognition skills that identify complex chart formations, harmonic patterns, and price action signals that provide high-probability trading opportunities in volatile global cryptocurrency markets. Advanced pattern recognition includes systematic identification of Elliott Wave patterns, Fibonacci retracement levels, and complex chart formations that predict future price movements with enhanced accuracy and reliability for professional cryptocurrency trading strategies.
Price action trading includes development of systematic trading methodologies based on candlestick patterns, support and resistance dynamics, and momentum analysis that provides clear entry and exit signals without relying on lagging indicators. Professional price action analysis includes understanding of market psychology, identification of institutional trading patterns, and strategic positioning based on pure price movement analysis that enhances trading accuracy whilstreducing complexity and improving decision-making speed for cryptocurrency trading excellence.
Risk Management Integration and Position Sizing Strategies
Professional technical analysis must integrate comprehensive risk management strategies that protect trading capital whilstmaximising profit potential through systematic position sizing, stop-loss placement, and portfolio management techniques specifically adapted for cryptocurrency market volatility. Risk management integration includes development of systematic position sizing algorithms, implementation of dynamic stop-loss strategies, and creation of comprehensive portfolio risk assessment frameworks that optimise risk-adjusted returns for cryptocurrency trading operations.
Position sizing strategies include implementation of volatility-adjusted position sizing, systematic evaluation of correlation risks across cryptocurrency positions, and development of comprehensive portfolio optimisation techniques that balance risk and reward while maintaining capital preservation. Professional risk management includes integration of technical analysis signals with systematic risk assessment, implementation of automated risk monitoring systems, and development of comprehensive trading rules that ensure consistent profitability whilstprotecting against significant losses in volatile global cryptocurrency markets.
Algorithmic Trading Integration and Systematic Analysis
Modern cryptocurrency technical analysis leverages algorithmic trading systems, automated signal generation, and systematic backtesting methodologies that enhance trading performance whilstreducing emotional decision-making and improving consistency in volatile market conditions. Algorithmic integration includes development of systematic trading rules based on technical indicators, implementation of automated signal generation systems, and creation of comprehensive backtesting frameworks that validate trading strategies before live implementation.
Systematic analysis includes utilisation of advanced statistical methods, implementation of machine learning algorithms for pattern recognition, and development of comprehensive performance monitoring systems that optimise trading strategies based on historical performance and market conditions. Professional algorithmic integration includes coordination with manual analysis techniques, implementation of risk management automation, and development of comprehensive decision support systems that enhance cryptocurrency trading performance while maintaining operational flexibility and strategic adaptability for professional trading excellence through systematic technical analysis and algorithmic optimisation.
Market Psychology and Sentiment Analysis Integration
Advanced cryptocurrency technical analysis incorporates market psychology principles, sentiment analysis techniques, and behavioral finance concepts that enhance traditional chart analysis with deeper understanding of market participant behavior and crowd psychology dynamics. Sentiment integration includes systematic evaluation of fear and greed indicators, analysis of social media sentiment patterns, and comprehensive assessment of market positioning data that provides additional confirmation for technical analysis signals and trading decisions.
Psychological analysis includes understanding of market cycles, identification of euphoria and panic phases, and strategic positioning based on contrarian analysis that capitalises on market inefficiencies created by emotional decision-making. Professional sentiment analysis includes integration of on-chain metrics, evaluation of institutional positioning data, and systematic assessment of market structure changes that indicate shifts in market psychology and provide strategic trading opportunities for sophisticated cryptocurrency market participants seeking enhanced returns through comprehensive technical and psychological market analysis excellence.
Advanced Technical Analysis Strategies and Professional Implementation
Multi-Timeframe Analysis and Confluence Trading
Professional technical analysis requires sophisticated multi-timeframe analysis that combines short-term, medium-term, and long-term chart patterns to identify high-probability trading opportunities with optimal risk-reward ratios. Advanced practitioners utilise confluence trading strategies that combine multiple technical indicators, chart patterns, and market structure analysis to validate trading signals and improve execution timing for enhanced profitability and risk management effectiveness.
Algorithmic Pattern Recognition and Automated Analysis
Modern technical analysis incorporates algorithmic pattern recognition systems that automatically identify chart patterns, calculate probability distributions, and generate trading signals based on historical pattern performance and market conditions. Professional traders utilise automated analysis tools that scan multiple cryptocurrency markets simultaneously, identify emerging patterns, and provide systematic alerts for high-probability trading opportunities while maintaining comprehensive risk management protocols and operational excellence through technological innovation and systematic analysis frameworks designed for professional cryptocurrency trading operations and institutional market participation that requires advanced technical analysis capabilities and sophisticated pattern recognition systems for optimal trading performance and risk-adjusted returns.
Market Psychology and Behavioral Analysis Integration
Advanced technical analysis incorporates market psychology principles and behavioral analysis techniques that enhance pattern recognition accuracy and improve trading decision-making through systematic understanding of market participant behavior and sentiment dynamics.
Advanced Technical Analysis Strategies for Professional Trading
Professional cryptocurrency technical analysis requires sophisticated understanding of market microstructure, advanced charting techniques, and comprehensive risk management frameworks that optimise trading performance while maintaining appropriate capital preservation standards. Advanced practitioners utilise multi-timeframe analysis, complex indicator combinations, and systematic backtesting methodologies to develop robust trading strategies that perform consistently across different market conditions and volatility environments through professional technical analysis excellence and strategic trading optimisation designed for sustainable long-term profitability and risk management in the evolving cryptocurrency markets with comprehensive analytical frameworks and professional trading excellence.
Market microstructure analysis examines order book dynamics, liquidity distribution patterns, and institutional trading behaviour that influences cryptocurrency price movements and technical pattern formation. Professional traders analyse bid-ask spreads, market depth characteristics, and order flow imbalances to identify optimal entry and exit points whilst minimising market impact and execution costs in volatile digital asset markets.
Conclusion
TA is a powerful tool for cryptocurrency trading when applied correctly with proper risk management. Success requires combining multiple analytical techniques, maintaining discipline, and continuously learning from both successes and failures.
Remember that chart analysis is not infallible - it provides probabilities, not certainties. Always use proper risk management, never risk more than you can afford to lose, and consider chart analysis as one component of a comprehensive trading strategy.
The cryptocurrency market's unique characteristics - including 24/7 trading, high volatility, and emerging regulatory landscape - require adapted TA approaches. Traditional indicators may behave differently in crypto markets due to lower liquidity, market manipulation, and sentiment-driven price movements. Successful crypto traders often combine classical chart analysis with blockchain-specific metrics, social sentiment analysis, and fundamental cryptocurrency research.
Continuous education remains essential for TA mastery. Markets evolve, new patterns emerge, and trading technologies advance rapidly. Successful traders dedicate time to backtesting strategies, analysing past trades, and staying updated with market developments. Consider joining trading communities, following experienced analysts, and practicing with paper trading before risking significant capital in live markets.
Key Takeaways for Successful Technical Analysis
The most successful cryptocurrency traders understand that chart analysis is both an art and a science. Whilst the mathematical indicators provide objective data points, interpreting these signals within the broader market context requires experience and intuition. Developing this skill takes time, patience, and consistent practice across different market conditions.
Market psychology plays a crucial role in TA effectiveness. Cryptocurrency markets are particularly driven by sentiment, news events, and social media trends. Understanding how these factors influence price action and technical patterns can significantly improve your analytical accuracy. Fear and greed cycles are especially pronounced in crypto markets, creating both opportunities and risks for technical traders.
Building Your Technical Analysis Expertise
Start with the fundamentals and gradually build complexity into your analysis. Master support and resistance levels, trend identification, and basic chart patterns before moving to advanced indicators and complex strategies. Many successful traders rely on simple, time-tested techniques rather than overcomplicated systems with dozens of indicators.
Keep detailed trading journals documenting your analysis, entry and exit points, and the reasoning behind each trade. Review these records regularly to identify patterns in your decision-making, both successful and unsuccessful. This self-analysis is invaluable for improving your TA skills and avoiding repeated mistakes.
Adapting to Market Evolution
Cryptocurrency markets continue evolving rapidly, with new trading instruments, market participants, and regulatory developments constantly changing market dynamics. Stay informed about these changes and adapt your chart analysis approach accordingly. What worked in previous market cycles may need adjustment for current conditions.
The integration of institutional investors, algorithmic trading, and derivatives markets has made cryptocurrency price action more sophisticated. Traditional technical analysis principles still apply, but market efficiency has improved, making some patterns less reliable while creating new opportunities for skilled analysts.
Start with basic concepts, practice on paper trades, and gradually develop your own systematic approach to crypto market analysis. The key to long-term success is consistency, discipline, and continuous improvement of your analytical skills. With dedication and proper application, TA can become a valuable tool for navigating the exciting but challenging world of cryptocurrency trading. Remember that successful trading combines technical analysis with fundamental research, risk management, and emotional discipline to successfully achieve sustainable long-term profitability in volatile global cryptocurrency markets.
Frequently Asked Questions
- What is TA in crypto trading?
- TA is the study of price movements and trading volume to predict future price direction in cryptocurrency markets using chart patterns and indicators.
- Which indicators work best for crypto trading?
- Popular indicators for crypto include RSI, MACD, moving averages, Bollinger Bands, and volume indicators, adapted for crypto's high volatility.
- How accurate is TA for cryptocurrency?
- TA accuracy varies, but it's most effective when combined with fundamental analysis and proper risk management. Crypto markets can be less predictable than traditional markets due to higher volatility.
- What timeframes should I use for crypto TA?
- Day traders typically use 5-minute to 1-hour charts, swing traders use 4-hour to daily charts, and long-term investors focus on daily to weekly charts. Multiple timeframe analysis provides better context.
- Can beginners learn TA for crypto trading?
- Yes, beginners can start with basic concepts like support/resistance, trend lines, and simple indicators like moving averages. Practice with paper trading before risking real capital, and gradually add more advanced techniques.
Sources & References
Financial Disclaimer
This content is not financial advice. All information provided is for educational purposes only. Cryptocurrency investments carry significant investment risk, and past performance does not guarantee future results. Always do your own research and consult a qualified financial advisor before making investment decisions.