TradingView Tutorial: Build Graph
TradingView is the world's most powerful charting platform used by millions of traders daily. This comprehensive guide teaches beginners everything they need to build professional crypto graphs, add indicators, set alerts, and save layouts. This tutorial covers 2025 features to start your journey today.
Introduction
TradingView has revolutionised financial market analysis. It's now the world's most comprehensive charting platform. The platform has over 50 million users. It supports more than 100,000 financial instruments. TradingView offers real-time data from major exchanges. It provides advanced technical indicators. The platform includes powerful social trading features. These tools democratise professional-grade market analysis. Accessibility is greatly improved. Costs are reduced significantly. Quality remains high.
The cryptocurrency market operates 24/7. It shows extreme volatility. This makes technical analysis essential. Proper analysis helps with trading decisions. It also helps with investment choices. TradingView addresses these challenges well. It provides institutional-quality charting capabilities. These tools were once only for professional traders. They were also limited to hedge funds. Now everyone can access them. The barrier to entry is low. Professional tools are affordable.
TradingView helps beginners enter crypto markets. The platform offers an intuitive learning environment. Complex technical analysis becomes accessible. Visual representation makes concepts clear. Interactive features help with learning. The platform has a social community aspect. New traders can learn from experienced analysts. They can follow successful trading strategies. Users develop analytical skills through practice. Candlestick patterns become recognisable. Chart formations are easier to spot. Understanding cryptocurrency fundamentals is essential first.
TradingView integrates with major cryptocurrency exchanges. This ensures accurate, real-time price data. The platform provides extensive libraries of technical indicators. Drawing tools enable comprehensive market analysis. Fibonacci retracements are available. Elliott Wave analysis is supported. Ichimoku clouds help identify trends. Pivot points show key levels. Support and resistance zones become clear. MACD crossovers signal momentum changes. RSI levels indicate overbought conditions. Bollinger Bands show volatility expansion. Consensus mechanisms validate transactions. Validators secure the network. Mining operations process blocks. Wallet security protects private keys. Exchange custody manages assets. Protocol governance enables upgrades.
Chart analysis is crucial in crypto trading. Price movements follow technical patterns. These patterns can be identified. They can be used for profitable trading. TradingView provides extensive analytical capabilities. Users can identify support levels. They can find resistance levels. The platform shows trend lines and chart patterns. It displays momentum indicators. These tools help with time market entries. They also help with exit decisions. Breakout patterns signal trend changes. Reversal formations indicate direction shifts. Volume confirms price movements.
This tutorial will guide you step by step. You'll learn to create professional crypto charts. We'll cover account setup first. Then we'll explore basic navigation. The guide includes advanced features too. You'll learn about custom indicators. We'll show you alert systems. Layout management is also covered. By the end, you'll have the skills needed. You can build sophisticated charts. These will enhance your trading decisions.
Modern crypto trading needs sophisticated tools. These tools process vast market data. They present it in actionable formats. TradingView meets this demand well. It offers cloud-based charting solutions. These work on desktop and mobile devices. Traders can monitor markets from anywhere. They can execute analysis globally.
Tokenomics analysis helps evaluate projects, APY calculations show yield potential, APR comparisons guide investment decisions, and understanding slippage, impermanent loss, and gas fees is crucial for DeFi participation. Security audits verify smart contract safety, governance tokens enable voting rights, staking mechanisms secure networks, and yield farming with liquidity mining maximises returns through innovative DeFi protocols. You must learn these terms first by studying each concept carefully, taking your time and practising regularly to improve your understanding quickly.
Professional traders rely on TradingView's advanced features, including multi-timeframe analysis, custom scripting using Pine Script language, and comprehensive backtesting tools that validate strategies before risking real capital. The platform provides extensive historical data coverage, laying the foundation for robust trading methodologies in which risk management is more effective, position sizing is optimised, stop-loss levels are calculated precisely, and entry points and exit strategies are planned systematically. Market timing improves significantly, trade execution becomes more accurate, and success rates increase through these professional-grade tools.
Social trading features create unique learning opportunities, allowing users to observe successful traders' strategies, analyse decision-making processes, and adapt proven techniques. This collaborative aspect accelerates learning curves as new traders benefit significantly from experienced analysts who share knowledge effectively and build reputations within the trading community. Copy trading becomes possible through signal providers offering insights, market sentiment analysis improves with community feedback for validation, trading ideas are shared freely, educational content is abundant, and mentorship opportunities exist throughout the platform.
This tutorial covers everything you need, whether you're a complete beginner learning step by step or an experienced trader enhancing your skills with TradingView's powerful features. Professional-grade charts support informed decisions through systematic technical analysis, seamless integration with fundamental analysis, and improved risk assessment, enabling more effective portfolio management. Chart patterns become easier to spot, market trends clearer, and trading signals more accurate, improving decision-making and profit potential when you start with simple setups and practice regularly while considering your risk tolerance.
Advanced charting features include multiple timeframe analysis, correlation studies revealing market relationships, volatility indicators measuring price fluctuations, and momentum oscillators showing trend strength. Volume profile analysis identifies key levels, market depth data shows the order book structure, and specialised chart types like tick charts, point-and-figure charts, Renko charts, and Heikin-Ashi candles provide different perspectives on price action. Understanding these concepts alongside blockchain technology, cryptocurrency markets, DeFi protocols, staking rewards, and smart contracts is essential for success, so start with the basics and learn gradually to avoid common mistakes.
Professional Trading Infrastructure and Data Quality
TradingView's infrastructure is impressive, processing millions of data points per second and connecting to over 500 crypto exchanges to deliver accurate, real-time market information with minimal latency. The data includes price and volume information, order book depth, trade history, and market microstructure data that help professional traders make informed decisions.
Data quality standards exceed industry benchmarks. Rigorous validation processes filter out bad trades. The system identifies market manipulation attempts. Data consistency is maintained across sources. Advanced algorithms monitor data feeds continuously. They watch for anomalies. The system automatically switches to backup sources. This maintains service during market volatility.
TradingView uses a cloud-based architecture that enables seamless scalability and handles massive traffic spikes well without performance degradation during major market events. The global server network ensures low latency worldwide, while sophisticated caching optimises chart loading times and reduces bandwidth requirements to provide the reliable foundation traders need.
Advanced Analytical Capabilities and Market Intelligence
TradingView offers advanced analytical capabilities that provide deep market insights, including powerful correlation analysis tools that help traders identify relationships between crypto pairs, connections to traditional markets, and macroeconomic indicators. This reveals opportunities for pairs trading, hedging strategies, and portfolio diversification approaches that are usually expensive and only available on institutional platforms.
The integrated market screener enables users to scan thousands of crypto pairs simultaneously based on technical criteria, fundamental metrics, and custom conditions for powerful systematic identification of trading opportunities across the entire crypto universe. Professional traders use these tools to discover emerging trends, identify breakout candidates, and monitor market-wide patterns beyond just major pairs.
TradingView integrates an economic calendar that provides crucial context for crypto price movements by highlighting scheduled events, announcements, and data releases that impact digital assets. This fundamental analysis complements technical analysis, helping traders anticipate volatility periods, position themselves before major announcements, and understand broader economic factors driving crypto adoption.
Institutional-Grade Security and Compliance Features
Security is crucial for crypto traders, and TradingView addresses these requirements with enterprise-level security protocols and compliance frameworks, including multi-factor authentication, encrypted data transmission, secure session management, and protected user accounts. Advanced security monitoring systems work continuously to scan for suspicious activities, detect unauthorised access attempts, and identify potential security threats to keep sensitive trading information safe.
Institutional users and professional trading firms benefit from enhanced security features, including single sign-on integration, IP whitelisting support, and audit trail capabilities that meet regulatory requirements. Large organisations can deploy TradingView safely while maintaining strict security standards and meeting regulatory compliance obligations.
The platform commits to data privacy. GDPR compliance is comprehensive. Data handling policies are transparent. Users control personal information sharing. Unlike many free platforms, TradingView doesn't monetise user data. The business model focuses on subscription revenue. User privacy remains a top priority. Data security is never compromised for revenue.
Why TradingView is Essential for Crypto Analysis
TradingView has become the industry standard for technical analysis across all financial markets, including cryptocurrency. The platform provides real-time data from major cryptocurrency exchanges, advanced charting tools, and a social community of traders who share ideas and strategies.
Whether you're a complete beginner or experienced trader, TradingView provides the tools needed to analyse price movements, identify trends, and make informed trading decisions. The platform's intuitive interface makes complex technical analysis accessible to everyone.
Getting Started: Creating Your TradingView Account
Before building your first chart, you'll need a TradingView account. The free plan provides access to basic charting features, while paid plans unlock advanced functionality:
- Free Plan: one saved layout, 2 indicators per chart, basic alerts
- Essential ($14.95/month): more saved layouts, 5 indicators per chart, 2 charts per tab, 20 alerts
- Plus ($29.95/month): 10 indicators per chart, 4 charts per tab, 100 alerts
- Premium ($59.95/month): 25 indicators per chart, 8 charts per tab, 400 alerts and premium data feeds
TradingView renamed these tiers (formerly Pro, Pro+ and Premium) and added a higher Ultimate plan; paying annually is cheaper than the monthly prices shown.
Most beginners can start with the free plan and upgrade as their analysis needs grow more sophisticated.
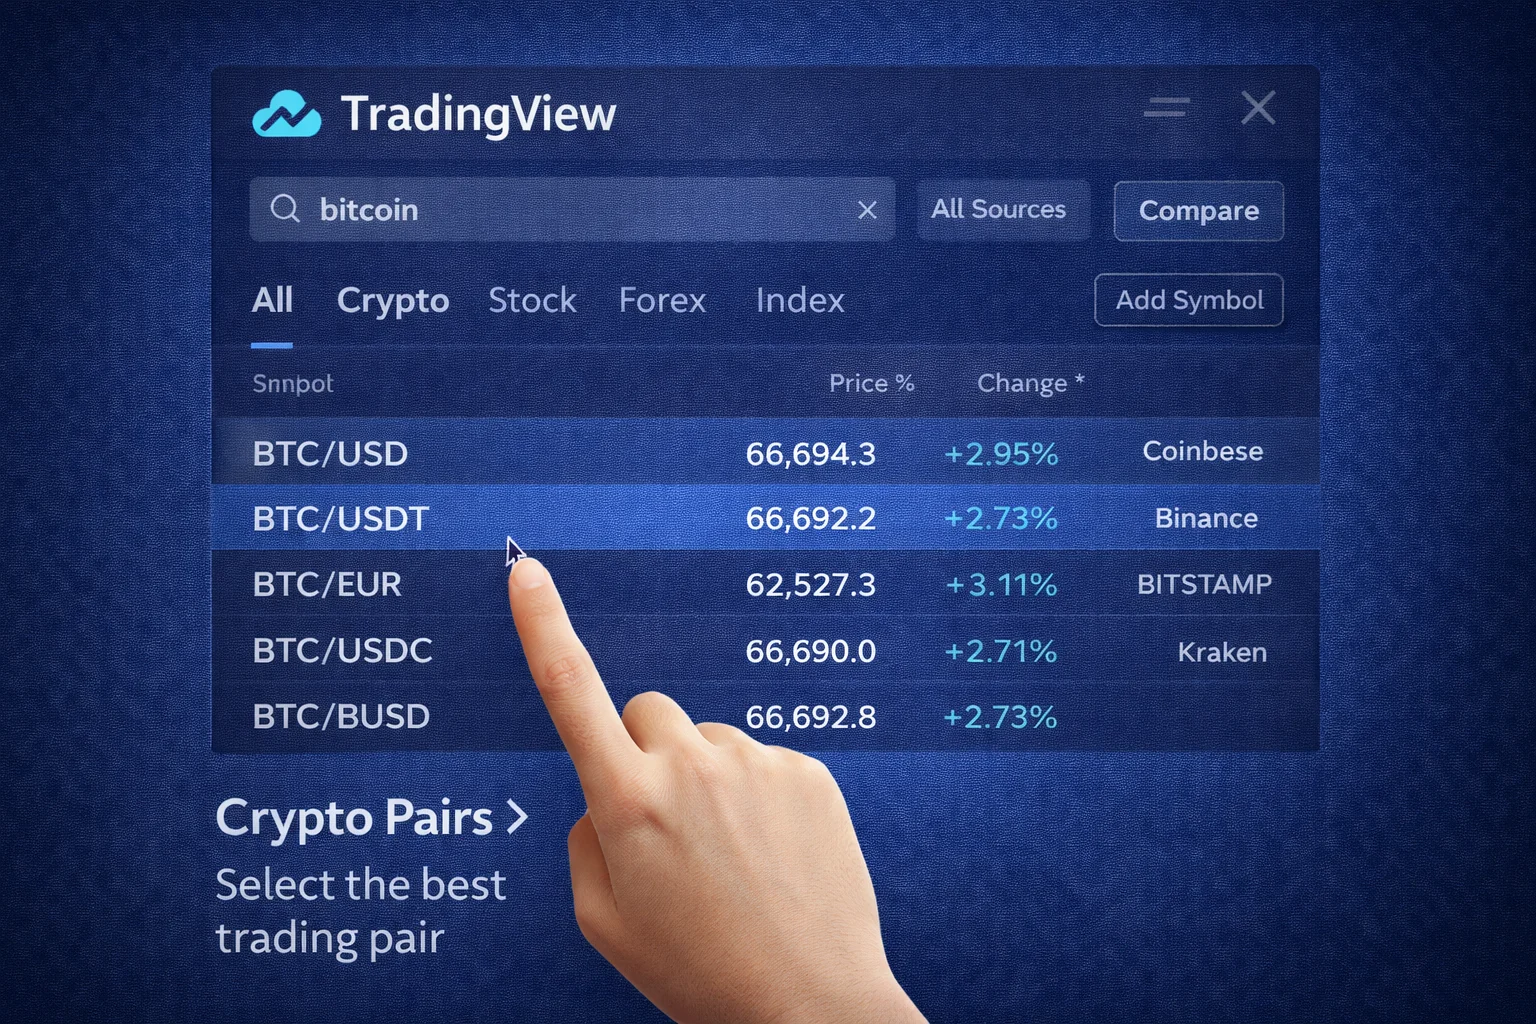
Step 1: Selecting Your Crypto Trading Pair
The first step is selecting your cryptocurrency pair to analyse, and TradingView aggregates data from hundreds of exchanges to give you access to virtually every crypto asset with excellent data quality through a simple selection process. You should start with major pairs like Bitcoin or Ethereum first, as your initial choice matters significantly for learning proper analysis on liquid markets with good trading volume.
How to Search for Crypto Pairs
- Click the search bar at the top
- Type your desired pair (BTCUSDT, ETHUSD, ADABTC)
- Select from dropdown results
- Choose your preferred exchange
- Popular exchanges include Binance, Coinbase Pro, Kraken, Bybit
Choosing the Right Exchange Feed
Different exchanges show slightly different prices due to liquidity variations and trading volume, so for most analyses, you should choose high-volume exchanges with tight spreads and verify their reputation to ensure better data quality.
- Binance: Highest volume for major pairs
- Coinbase Pro: Good for USD pairs and institutional data
- Kraken: Reliable European exchange with EUR pairs
- Bybit: Popular for derivatives and perpetual contracts
For detailed exchange analysis, explore our TradingView review. Check our exchange comparison too.
Step 2: Understanding and Setting Timeframes
Timeframes are crucial for chart analysis as they determine the period each candlestick or bar represents, and choosing the right timeframe that matches your trading style is essential because different timeframes show different market perspectives. You should understand this concept and start with daily charts, avoiding very short timeframes until you match your goals and trading style properly.
Common Timeframes and Their Uses
- 1 Minute (1m): Scalping and very short trades (not for beginners)
- 5 Minutes (5m): Short-term day trading
- 15 Minutes (15m): Intraday analysis and quick trades
- 1 Hour (1H): Short to medium-term analysis, good for beginners
- 4 Hours (4H): Medium-term trends, excellent for swing trading
- 1 Day (1D): Long-term trends and position trading
- 1 Week (1W): Very long-term analysis and major trend identification
Multiple Timeframe Analysis
Professional traders use multiple timeframes to get a complete market picture through a systematic approach that reduces trading errors. You should learn this technique using three timeframes, starting with higher ones first, as this best practice will improve your analysis dramatically.
- Higher Timeframe (1D or 1W): Identify overall trend direction
- Medium Timeframe (4H or 1H): Find entry and exit points
- Lower Timeframe (15m or 5m): Fine-tune entry timing
Step 3: Choosing Graph Types
TradingView offers several graph types that provide different perspectives on price action, and different traders prefer different types as the choice affects analysis quality. You should try each type to develop your preference naturally, starting with candlesticks and experimenting with different styles to choose what works best for your analysis.
Candlestick Graphs (Recommended)
Candlestick graphs are most popular for crypto analysis as they show four key price points for each time period with comprehensive information. You should learn candlestick patterns by studying Japanese candlesticks and practicing pattern recognition, as these patterns repeat frequently and will significantly improve your analysis.
- Open: Price at period beginning
- High: Highest price during period
- Low: Lowest price during period
- Close: Price at period end
Green candles indicate bullish movement where the close was higher than the open, while red candles show bearish movement where the close was lower than the open. White and black are alternatives, and colour coding helps quick identification of market direction.
Other Graph Types
- Line Graphs: Simple lines connecting closing prices, good for trends
- Bar Graphs: Similar to candlesticks but with vertical lines
- Area Graphs: Line graph with filled area, useful for long-term trends
- Heikin Ashi: Modified candlesticks that smooth price action
Step 4: Adding Technical Indicators
Technical indicators are mathematical calculations using price and volume data to identify trends, momentum, and potential reversal points, and TradingView offers hundreds of indicators. Beginners should start with essentials and avoid using too many indicators, as this causes confusion and clutters your charts. Focus on quality over quantity by using 2-3 indicators maximum to keep your analysis clean and effective.
Essential Indicators for Beginners
Moving Averages (MA)
Moving averages smooth out price data to make trend direction clear by reducing noise and filtering short-term fluctuations so the overall direction becomes visible. Different periods show different trends, with common periods being 20, 50, and 200, each serving different purposes. You should start with a simple 50-period moving average first, then add a 200-period later, using different colours and line thickness to distinguish them easily.
- 50-period MA: Short-term trend indicator
- 200-period MA: Long-term trend indicator
- Golden Cross: When 50 MA crosses above 200 MA (bullish signal)
- Death Cross: When 50 MA crosses below 200 MA (bearish signal)
Relative Strength Index (RSI)
RSI measures momentum and identifies overbought/oversold conditions:
- RSI above 70: Potentially overbought (sell signal)
- RSI below 30: Potentially oversold (buy signal)
- RSI divergence: When price and RSI move in opposite directions
Volume
Volume shows trading activity levels by measuring shares or contracts traded, and it confirms price movements where high volume validates trends while low volume suggests weakness. Volume analysis is essential for technical analysis as it helps identify market sentiment and institutional activity through volume spikes. You should always check volume first using volume bars, remembering the key principle that volume leads price for more accurate analysis.
- High volume + price increase: Strong bullish momentum
- High volume + price decrease: Strong bearish momentum
- Low volume: Weak momentum, potential reversal
- Volume divergence: Price moves without volume confirmation
- Accumulation phase: High volume with sideways price action
- Distribution phase: Selling pressure increases gradually
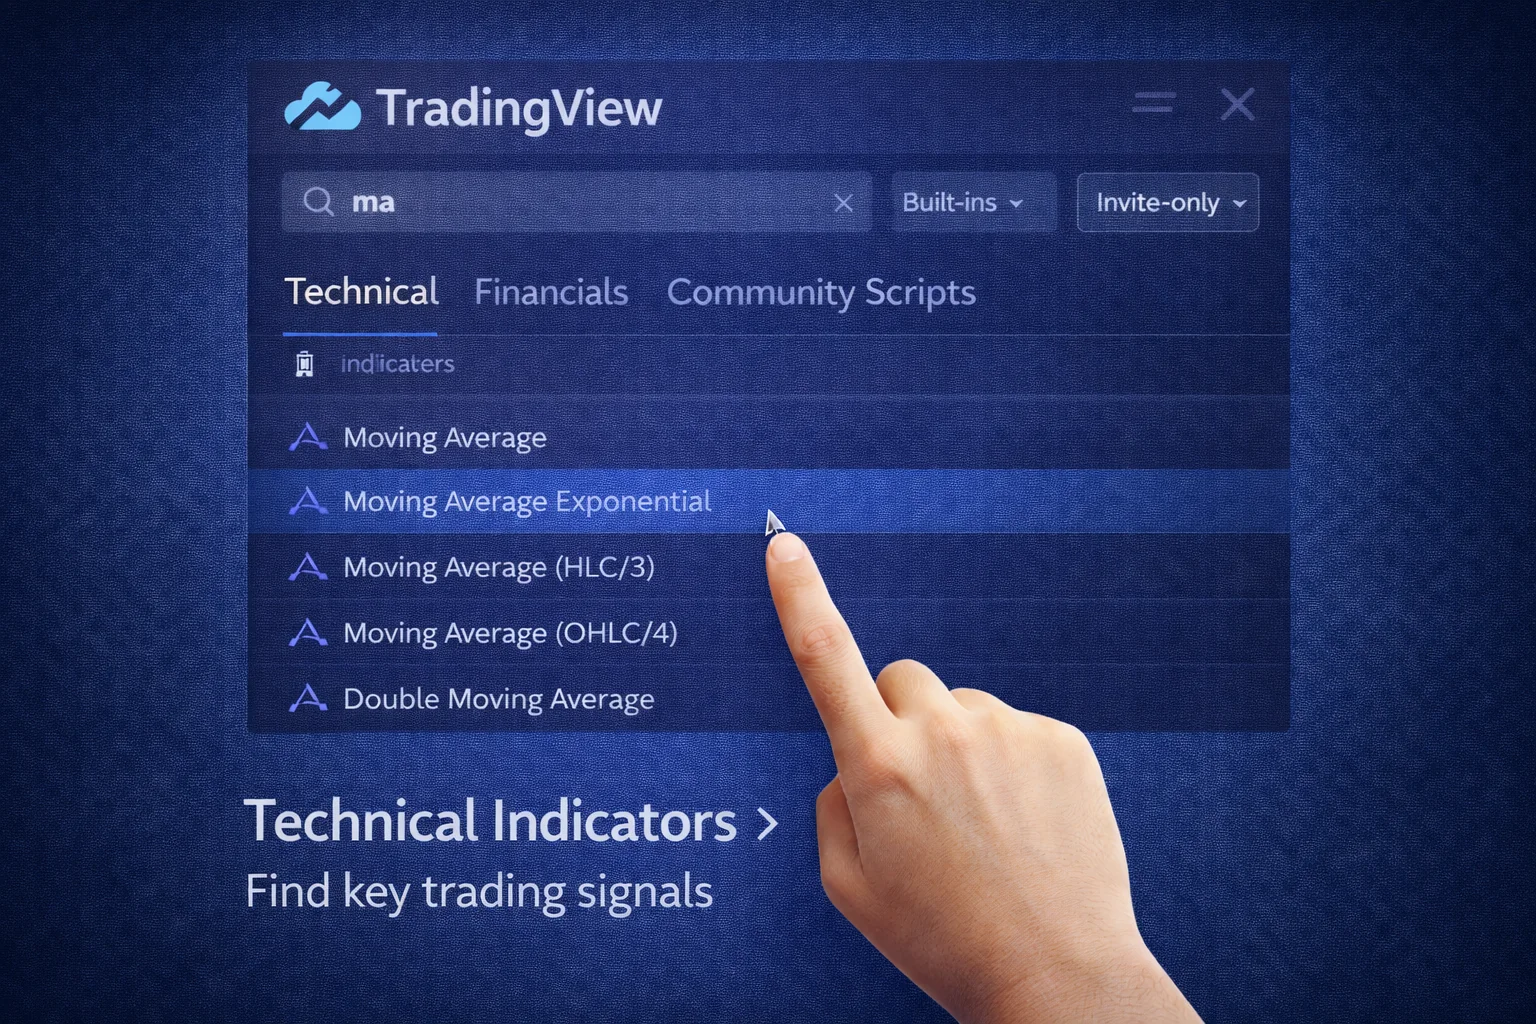
How to Add Indicators
- Click the "Indicators" button at the top
- Search for your desired indicator (Moving Average, RSI, MACD)
- Click on the indicator to add it
- Adjust settings using the gear icon
- Customise colours, line thickness, and parameters
- Save indicator templates for future use
- Create custom indicator combinations
Step 5: Customising Your Chart Layout
Chart layout organisation improves analysis efficiency and reduces visual clutter significantly through TradingView's extensive customisation options that let you create the perfect setup for your trading style. Professional traders optimise their workspace because chart aesthetics affect decision-making quality, so you should spend time creating clean layouts that avoid overcrowding and remember to save your work for increased productivity.
Visual customisation Options
- colour Scheme: Light and dark themes available
- Candlestick colours: Customise bullish and bearish candles
- Background: Adjust colour and transparency levels
- Grid Lines: Show or hide price and time grids
- Scale: Linear and logarithmic price scales
- Font Size: Adjust text readability
- Chart Type: Candlesticks, bars, line charts, Heikin Ashi
organising Indicators
Proper indicator organisation prevents chart clutter through visual hierarchy, where related indicators should be grouped with colour coding for identification and consistent styling to improve analysis speed. You must organise indicators properly using consistent colours, grouping similar indicators, and using transparency wisely to make your charts look professional.
- Price Overlay: Moving averages, Bollinger Bands, support/resistance
- Separate Panes: RSI, MACD, Volume, Stochastic oscillator
- colour Coding: Consistent colours for related indicators
- Line Thickness: Important levels more visible
- Transparency: Background indicators less prominent
Step 6: Setting Up Alerts
TradingView alerts notify you when specific conditions are met, allowing you to monitor markets without constantly watching charts.
Types of Alerts
- Price Alerts: Trigger when price reaches a specific level
- Indicator Alerts: Activate when indicators cross certain thresholds
- Drawing Alerts: Fire when price touches trend lines or support/resistance
- Strategy Alerts: Based on custom trading strategies
Creating Your First Alert
- Right-click on your chart where you want the alert
- Select "Add Alert" from the context menu
- Choose your alert condition (price, indicator, etc.)
- Set the trigger value and frequency
- Choose notification methods (email, mobile app, webhook)
- Click "Create" to activate the alert
Step 7: Saving and Managing Chart Layouts
Saving your chart layouts allows you to quickly access your preferred setups and maintain consistency across different trading sessions.
How to Save Layouts
- Set up your chart with desired indicators and customisations
- Click the "Save" button (floppy disk icon) at the top of the chart
- Give your layout a descriptive name (e.g., "BTC Swing Trading")
- Choose whether to make it your default layout
- Click "Save" to store the layout
Layout Management Tips
- Descriptive Names: Use clear names that indicate the purpose
- Multiple Layouts: Create different layouts for different strategies
- Regular Updates: Modify layouts as your analysis evolves
- Backup Important Layouts: Export layouts for safekeeping
Quick Start: Build Your First Chart
- Open a market & pair. In the top search, type
BTCUSDT(or your preferred asset) → select a liquid exchange feed (e.g., BINANCE:BTCUSDT) - Set timeframe. Choose
1Dfor swing trading or4Hfor shorter-term analysis. Ensure timezone matches your location - Choose chart type. Switch to Candlesticks for comprehensive price information
- Add volume. Right-click → Insert Indicator → search "Volume" → add to chart
- Add core indicators. Add Moving Average
50&200, plus RSI14(Indicators → search for each) - customise appearance. Colour-code MAs (blue for 50, orange for 200), adjust line thickness for clarity
- Create alerts. Right-click price → Add alert → set conditions like "Price crosses MA50" or "RSI crosses 70"
- Save your layout. Click Save → name it descriptively (e.g., "BTC Daily Analysis") → enable autosave
- Test on mobile. Download the TradingView app and verify your layout syncs correctly
- Share if needed. Use the Share button to copy the chart link or create a snapshot for social media
Pro tips & keyboard shortcuts
- / opens quick search; , edits indicator settings; Alt + drag = quick clone drawing tools
- Keep only 2–3 indicators visible to avoid analysis paralysis; focus on price action first
- Use Object Tree (right panel) to toggle layers (drawings/indicators) quickly
- Ctrl + Z undoes actions; Ctrl + Y redoes them
- Double-click any indicator to access its settings quickly
TradingView Updates and New Features
AI-Powered Analysis Tools
TradingView introduced AI-powered features in 2025 that enhance chart analysis significantly through machine learning algorithms improving accuracy, automated pattern recognition, integrated market sentiment analysis, and predictive models adapting to conditions. You should explore these AI tools to make your analysis more powerful, remembering that AI assists human judgement and you should verify AI suggestions before acting on them.
- Pattern Recognition AI: Identifies triangles, head and shoulders, flags automatically
- Smart Alerts: AI suggests optimal alert levels using historical data
- Sentiment Analysis: Social media sentiment integrates into charts
- Predictive Indicators: Machine learning indicators adapt to market conditions
- Neural Networks: Deep learning models analyse price patterns
- Algorithmic Trading: Automated strategy execution capabilities
Enhanced Mobile Experience
The 2025 mobile app update brings major improvements, including optimised touch controls, voice commands, enhanced offline functionality, and smartwatch integration. You should download the mobile app to increase your trading flexibility, using both desktop and mobile versions while syncing your layouts and enabling notifications for the best experience.
- Touch-optimised drawing tools: Easier trend lines and patterns on mobile
- Voice commands: Set alerts and search symbols using voice
- Offline charts: View saved charts without internet
- Apple Watch integration: Alerts and price data on smartwatch
- Haptic feedback: Touch responses for better user experience
- Dark mode optimisation: Battery-saving display options
Institutional Features
New professional-grade features added in 2025:
- Order flow analysis: Advanced volume profile and market depth visualization
- Multi-exchange arbitrage: Compare prices across exchanges in real-time
- Risk management tools: Position sizing calculators and portfolio risk metrics
- API improvements: Enhanced data feeds and webhook capabilities
Advanced Features for Growing Traders
Multi-Chart Layouts
As you become more experienced, you can create multi-chart layouts to monitor multiple assets or timeframes simultaneously:
- Correlation Analysis: Compare BTC with altcoins
- Multiple Timeframes: View 1D and 4H charts side by side
- Cross-Market Analysis: Monitor crypto alongside traditional markets
Drawing Tools
TradingView offers comprehensive drawing tools for technical analysis:
- Trend Lines: Connect highs and lows to identify trends
- Support/Resistance: Mark key price levels
- Fibonacci Retracements: Identify potential reversal levels
- Chart Patterns: Highlight triangles, flags, and other formations
Social Features
TradingView's social platform allows you to:
- Follow Traders: Learn from experienced analysts
- Share Ideas: Publish your own analysis
- Join Discussions: Participate in market conversations
- Copy Strategies: Implement proven trading approaches
Recommended Starter Layout Preset
Use this beginner-friendly setup to start with a clean layout where effective charting begins. You should copy this setup exactly for faster learning, keeping it simple initially and remembering to save your layout for future use.
- Chart type: Candlesticks with dark background theme
- Timeframe:
4Hfor short-term analysis or1Dfor swing trading - Essential indicators:
- Moving Average (50) → blue colour, 2px line thickness
- Moving Average (200) → orange colour, 2px line thickness
- RSI (14) → default settings with 70/30 overbought/oversold levels
- Volume → enabled as overlay bars at bottom of chart
- Visual settings: Light grey gridlines with reduced opacity for clarity
- Alerts: Set for MA crossovers and RSI extreme levels
- Layout name: "Crypto Starter Setup" with autosave enabled
Common Mistakes to Avoid
Beginners make predictable errors that you should learn from to make your progress faster, as these mistakes can be expensive. Study these warnings to avoid common pitfalls in your trading journey.
- Indicator Overload: Don't add too many indicators; they create confusion
- Wrong Timeframes: Match timeframe to your trading style
- Ignoring Volume: Always consider volume when analysing price
- Not Saving Layouts: Save your setups to maintain consistency
- Chasing Signals: Don't act on every signal; wait for confirmation
Professional Trading Psychology and Discipline
Trading psychology is critical for success, as many traders fail due to emotions and make poor decisions under pressure, where technical analysis alone isn't enough and emotional control is essential. Professional traders follow systematic approaches, sticking to predetermined plans that don't let market fluctuations affect their decisions and that effectively control impulses. You must develop discipline first through meditation practice, remembering that psychology beats technique, and staying calm at all times to prevent your emotions from sabotaging profits.
Analytical discipline starts with planning, in which trading plans specify entry criteria, define exit criteria clearly, set risk control parameters, and establish position sizing rules before market analysis begins. TradingView's alert system helps maintain discipline by automating notification processes to reduce impulsive decisions and make real-time price movements less tempting. Professional traders set alerts for predetermined levels and wait patiently for conditions without constantly monitoring charts or second-guessing their decisions. You must develop this discipline with strict rules, sticking to your plan and being patient always, as your profits depend on it.
Backtesting capabilities validate analytical approaches using historical data, build confidence, and thoroughly test methodologies, reducing emotional uncertainty during live trading. Systematic validation helps traders understand statistics, including win rates, profit and loss ratios, and maximum drawdown periods, which maintains psychological composure during losing streaks and prevents abandoning profitable strategies during temporary adverse periods. You should backtest everything thoroughly to build your confidence, remembering that past performance doesn't guarantee future results and staying realistic about expectations.
Advanced Risk Management Through Chart Analysis
Professional portfolio protection goes beyond stop-loss placement to encompass comprehensive portfolio-level risk assessment with dynamic position sizing based on market volatility and correlation analysis. TradingView's advanced charting enables sophisticated risk-control approaches that adapt to changing market conditions and protect capital during periods of uncertainty, integrating risk management directly into chart analysis. This skill separates professional traders from amateur market participants, so you must learn risk management first with simple rules like never risking more than 2% and always using stop losses, as your capital preservation depends on it.
Advanced risk control techniques include using Average True Range (ATR) indicators to determine appropriate stop-loss distances based on current market volatility, conducting correlation analysis to avoid overconcentration in related assets, and employing position-sizing algorithms that adjust trade sizes based on the probability of success and potential risk-reward ratios. TradingView's scripting capabilities enable automation of these risk management calculations, ensuring consistent application of risk parameters across all trading decisions.
Portfolio-level risk control involves monitoring aggregate exposure across multiple positions, understanding how individual trades contribute to overall portfolio risk, and implementing hedging strategies when appropriate. Professional traders use TradingView's multi-chart layouts to monitor portfolio-wide risk metrics alongside individual position analysis, ensuring their trading aligns with broader risk management objectives and capital preservation goals.
Institutional-Grade Analysis Techniques and Market Structure
Understanding institutional trading behaviour and market microstructure provides significant advantages in cryptocurrency markets where large players can dramatically influence price movements and liquidity conditions. TradingView's advanced features enable retail traders to access institutional-grade analysis techniques that were previously available only to professional trading firms and hedge funds. These capabilities include order flow analysis, volume profile interpretation, and market depth visualization that reveal the underlying supply and demand dynamics driving price movements.
Professional market structure analysis involves identifying key support and resistance levels based on actual trading activity rather than arbitrary technical levels. Volume Profile analysis shows where institutional traders have established significant positions, creating areas of strong support or resistance that often persist across multiple timeframes. Understanding these institutional footprints enables better trade timing and more accurate prediction of potential price reactions at key levels.
Advanced practitioners learn to recognise institutional accumulation and distribution patterns that precede major price movements. These patterns often develop over extended periods and require careful observation of volume characteristics, price action behaviour, and market participation metrics. TradingView's comprehensive data coverage and analytical tools enable detailed study of these institutional patterns, providing insights that can significantly improve trading performance and market timing accuracy.
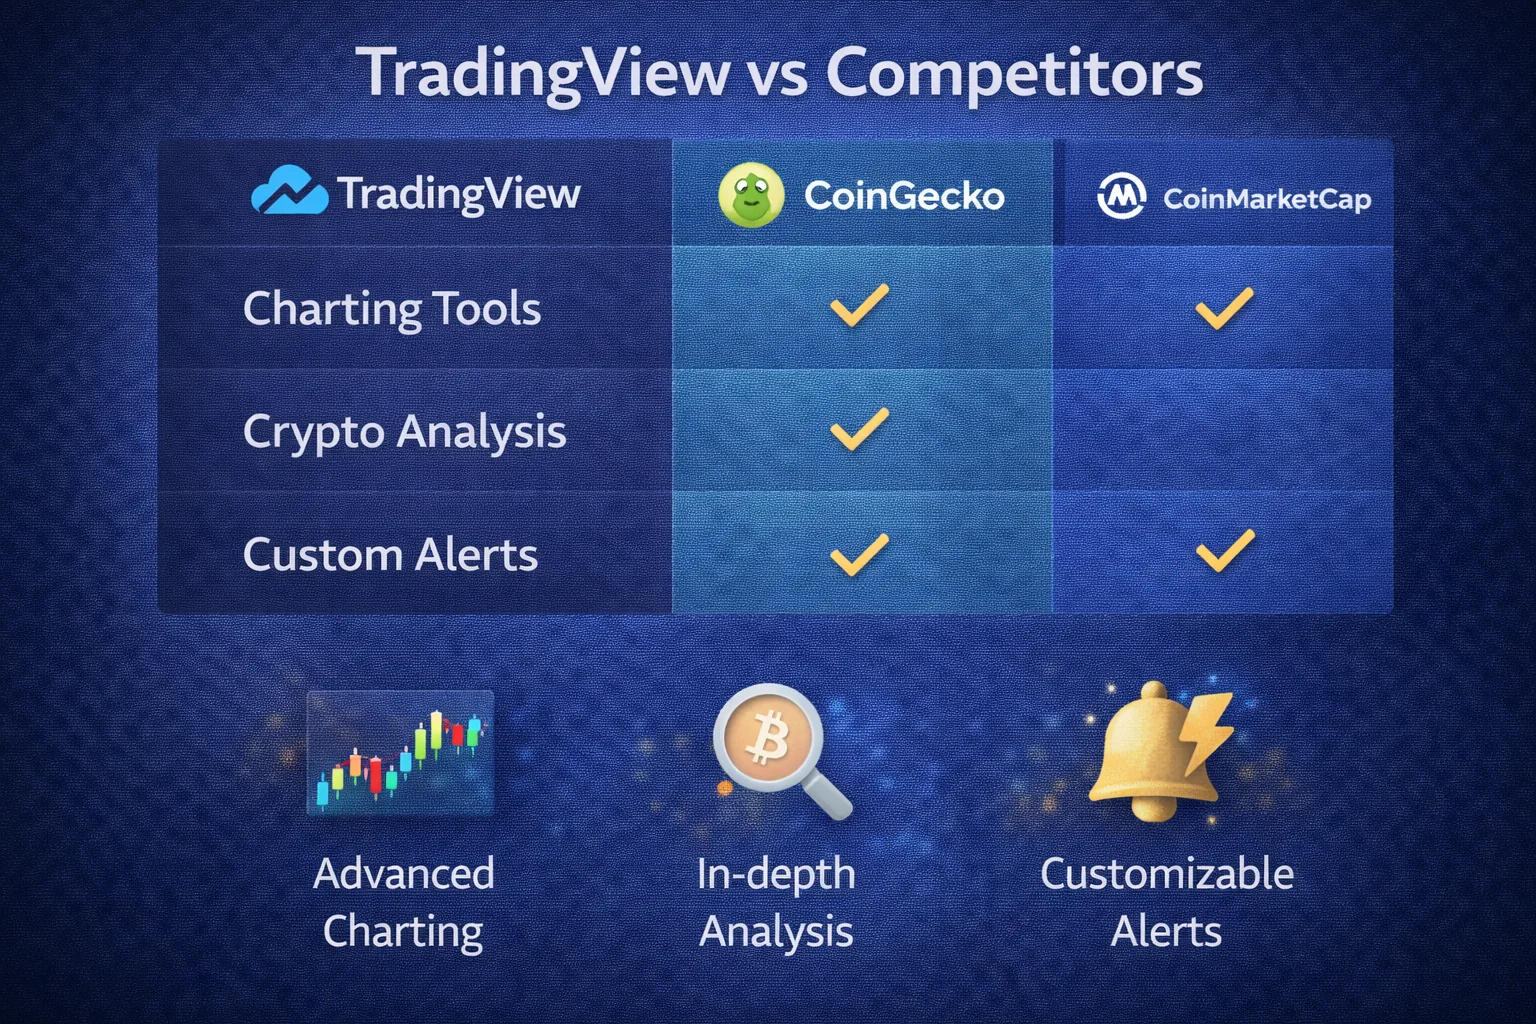
TradingView vs Competitors
| Feature | TradingView | Binance Charts | Coinbase Pro | MT4/MT5 |
|---|---|---|---|---|
| Crypto Coverage | 500+ exchanges | Binance only | Coinbase only | Limited |
| Indicators | 100+ built-in | 20+ basic | 15+ basic | 50+ built-in |
| Social Features | Full community | None | None | Limited |
| Mobile App | Full featured | Basic charts | Basic charts | Limited |
| Custom Scripts | Pine Script | None | None | MQL4/MQL5 |
| Free Plan | Yes, robust | Yes, basic | Yes, basic | Yes, full |
Why TradingView Leads
- Universal access: One platform for all markets (crypto, stocks, forex, commodities)
- Community insights: Learn from millions of traders sharing ideas
- Continuous innovation: Regular updates with AI analysis features
- Professional grade: Used by institutional and retail traders
- Cross-platform sync: Works on desktop, mobile, and web
You should consider these benefits, as your trading will improve significantly when you explore each feature, starting with the free plan and upgrading when ready. Community features are valuable, so consider joining discussions early in your learning journey.
Next Steps: Developing Your Analysis Skills
Building your first chart is just the beginning of your technical analysis journey, as TradingView proficiency and crypto analysis require time and practice. You should follow these steps with daily practice, starting small and being patient, as your progress will be steady.
- Practice Daily: Spend time each day analysing different crypto pairs
- Learn Patterns: Study common chart patterns and their implications
- Follow Experts: Watch experienced traders and learn from their analysis
- Keep a Trading Journal: Record your analysis and track accuracy over time
- Stay Updated: Follow TradingView's educational content and feature updates
Remember that technical analysis is a skill that improves with practice and experience. Start with simple setups and gradually add complexity as you become more comfortable with the platform and market dynamics. For comprehensive crypto tools, check our crypto tools comparison.
Advanced Charting Techniques for Professional Analysis
Multi-Timeframe Analysis Strategy
Professional cryptocurrency traders employ multi-timeframe analysis to gain a comprehensive market perspective and improve trading accuracy. This sophisticated approach involves analysing the same asset across different time horizons, typically using weekly charts for long-term trend identification, daily charts for intermediate-term analysis, and hourly charts for precise entry and exit timing. The key principle is to align across different timeframes before executing trades, which significantly improves success rates and reduces false signals.
Implementing multi-timeframe analysis in TradingView requires systematic chart organisation and disciplined analytical processes. Start by identifying the primary trend on higher timeframes, then use intermediate timeframes to spot potential reversal or continuation patterns, and finally utilise lower timeframes for optimal trade execution. This hierarchical approach ensures that short-term trading decisions align with broader market dynamics, reducing the likelihood of trading against major trends and improving overall profitability.
Volume Profile and Market Structure Analysis
Volume Profile represents one of TradingView's most powerful features for understanding market structure and identifying key support and resistance levels based on actual trading activity. Unlike traditional horizontal support and resistance lines, Volume Profile shows the price levels where the most trading volume occurred, revealing areas where institutional traders and market makers are most active. These high-volume nodes often act as significant support or resistance levels, offering excellent trading opportunities.
Advanced Volume Profile analysis includes identifying Value Area High and Low levels, Point of Control zones, and volume gaps that indicate areas of low liquidity where price movements can be particularly volatile. Professional traders use these insights to position trades around high-probability zones, set more accurate stop-loss levels, and identify potential breakout areas where significant price movements are likely. Understanding market structure through volume analysis provides a significant edge in cryptocurrency trading, where traditional fundamental analysis may be limited.
Custom Indicator Development with Pine Script
TradingView's Pine Script programming language enables traders to create custom indicators, strategies, and alerts tailored to their specific trading methodologies and market observations. Learning Pine Script opens unlimited possibilities for developing unique analytical tools that can identify patterns and opportunities not available through standard indicators. This programming capability allows traders to backtest strategies, automate analysis, and create sophisticated trading systems that operate according to predefined rules and criteria.
Developing custom indicators requires understanding both programming concepts and market dynamics, but the investment in learning Pine Script pays significant dividends through improved analytical capabilities and trading automation. Start with simple modifications to existing indicators, gradually building complexity as your programming skills develop. The TradingView community offers extensive resources, examples, and collaboration opportunities that accelerate learning and inspire innovative analytical approaches.
Risk Management Integration and Position Sizing
Professional chart analysis must integrate comprehensive risk control principles that protect capital while maximising profit potential. TradingView's advanced features enable sophisticated portfolio protection through position-sizing calculators, risk-reward ratio analysis, and automated alert systems that help maintain disciplined trading. Effective risk control involves determining appropriate position sizes based on account equity, volatility measurements, and individual risk tolerance levels.
Advanced risk management techniques include using Average True Range (ATR) for dynamic stop-loss placement, implementing trailing stop strategies that protect profits whilstallowing for continued upside participation, and developing systematic approaches to position scaling that optimise risk-adjusted returns. Professional traders integrate these risk control principles directly into their charting analysis, ensuring that every trade setup includes clear risk parameters and profit targets before execution.
Market Psychology and Sentiment Analysis Through Charts
Understanding Crowd Psychology in Price Action
Cryptocurrency markets are driven by collective psychology and emotional responses that create predictable patterns in price action and volume behaviour. Professional chart analysis involves understanding how fear, greed, and uncertainty manifest in market movements, enabling traders to anticipate potential reversals and continuation patterns based on psychological dynamics rather than purely technical factors. This psychological perspective provides deeper insights into market behaviour and improves the accuracy of technical analysis.
Chart patterns like head and shoulders, double tops and bottoms, and triangle formations represent visual manifestations of market psychology where buyers and sellers battle for control. Understanding the psychological narrative behind these patterns enhances their predictive value and helps traders position themselves advantageously relative to crowd behaviour. Professional traders learn to recognise when markets are driven by emotion rather than rational analysis, and adjust their strategies accordingly to capitalise on psychological extremes.
Sentiment Indicators and Social Trading Features
TradingView's social features provide valuable sentiment analysis tools that complement traditional technical analysis with real-time market psychology insights. The platform's idea-sharing, comment systems, and trader sentiment indicators offer glimpses into collective market thinking that can yield contrarian trading opportunities or confirm existing analytical conclusions. Professional traders monitor these social signals alongside technical indicators to gain a comprehensive market perspective.
Advanced sentiment analysis involves tracking the publication frequency and tone of trading ideas, monitoring the ratio of bullish to bearish sentiment across different timeframes, and identifying when extreme sentiment readings suggest potential market reversals. Contrarian traders often find the most profitable opportunities when social sentiment reaches extreme levels, as these conditions frequently precede significant price movements in the opposite direction.
Behavioural Finance Applications in Cryptocurrency Trading
Behavioural finance principles provide frameworks for understanding how cognitive biases and emotional responses affect trading decisions and market movements. Common biases like confirmation bias, anchoring, and loss aversion create predictable patterns in market behaviour that skilled chart analysts can identify and exploit. Understanding these psychological factors improves both analytical accuracy and personal trading discipline.
Professional traders develop systematic approaches that account for behavioural biases in both their own decision-making processes and broader market behaviour. This includes creating objective, analytical frameworks that reduce emotional influence, implementing systematic review processes to identify bias-driven errors, and developing trading rules that counter common psychological pitfalls. The integration of behavioural finance principles with technical analysis creates a more comprehensive and effective trading approach.
Advanced Charting Techniques and Professional Strategies
Professional chart analysis extends beyond basic indicator application to encompass sophisticated analytical frameworks that integrate multiple timeframes, correlation analysis, and market structure evaluation. Advanced practitioners develop systematic approaches to chart interpretation that account for market context, volatility regimes, and institutional trading patterns that influence cryptocurrency price movements across different market conditions and time horizons.
Multi-timeframe analysis represents a cornerstone of professional charting methodology, enabling traders to understand market structure across different temporal perspectives while maintaining coherent analytical frameworks. This approach includes understanding how daily trends relate to weekly patterns, how intraday movements fit within longer-term market cycles, and how to synchronise entry and exit timing across multiple timeframes for optimal risk-adjusted returns.
Institutional-grade chart analysis incorporates understanding of market microstructure, order flow dynamics, and liquidity patterns that create predictable price movements around key technical levels. Professional traders learn to identify institutional accumulation and distribution patterns, recognise algorithmic trading signatures, and understand how large order execution affects price action and creates trading opportunities for skilled analysts.
Professional Implementation Strategies and Best Practices
Strategic Planning and Risk Assessment Framework
TradingView users employ analysis diversification strategies using multiple timeframes, different indicator types, and chart patterns to minimise false signal risks and maintain trading accuracy. Regular chart review, indicator optimisation, and pattern validation are essential in volatile markets. You should diversify your approach to improve accuracy using multiple strategies while avoiding reliance on single indicators and validating patterns carefully.
Advanced Security and Operational Excellence
TradingView security protocols include account protection systems, secure data transmission, and comprehensive privacy controls to safeguard your trading analysis and personal information. Professional traders implement additional measures, including API key management, secure connection practices, and the protection of market analysis. You must prioritise security at all times by using strong passwords, enabling two-factor authentication, logging out properly, using secure networks, avoiding public WiFi, and keeping software up to date to protect your data.
Market Intelligence and Competitive Analysis
TradingView chart construction involves understanding timeframes, crucial indicator selection, and drawing tool utilisation to enable effective technical analysis. Professional traders utilise multiple layouts, custom indicator combinations, and systematic analysis workflows to more clearly identify trading opportunities. You should learn these skills through systematic approaches and consistent practice to improve your analysis.
TradingView chart construction requires understanding proper timeframe selection, indicator selection, and drawing tool utilisation to improve your analysis through effective technical analysis practice. Building comprehensive charts involves layering multiple indicators together, setting up alerts, and customising layouts to make systematic trading decisions easier as your skills develop through daily practice, starting simple and being patient with your progress.
Conclusion
Mastering TradingView's charting is crucial for developing professional cryptocurrency analysis skills, thanks to its comprehensive tools, intuitive interface, and extensive educational resources that provide everything needed for effective market analysis and informed trading decisions. This tutorial gives you foundational knowledge to build sophisticated charts that enhance market understanding, improve trading performance significantly, and make success achievable.
The journey from beginner to analyst requires consistent learning and practice, starting with simple chart setups using basic indicators like moving averages and RSI before gradually adding advanced tools as your understanding deepens. Success requires systematic approaches where chart analysis aligns with your trading style, risk tolerance, and time commitment, recognizing that progress takes time and dedication.
TradingView's social features offer learning opportunities, with experienced traders sharing valuable insights and strategies publicly. Engage with the community actively by studying published ideas carefully, following successful traders, and participating in discussions regularly, as this collaborative environment accelerates learning by exposing you to diverse analytical perspectives that improve your own trading approach through continuous learning.
Technical analysis is one component of successful cryptocurrency trading that must be combined with fundamental research, risk management principles, and emotional discipline to build comprehensive trading strategies. No indicator guarantees success, and chart patterns aren't foolproof, but proper analysis improves your ability to identify high-probability trading opportunities and avoid costly mistakes. Learn about crypto risk management strategies to start simple and build your skills gradually through daily practice.
Continue developing your TradingView skills systematically by establishing consistent routines for analysis, maintaining detailed trading journals, and regularly reviewing performance to identify areas for improvement. Advanced features like Pine Script programming, strategy backtesting, and custom indicator development become valuable as you tailor everything to your specific trading needs based on market observations and experience gained through dedicated practice consistently over extended time periods.
Sources & References
- TradingView. (2025). TradingView Help centre. Official documentation and tutorials.
- TradingView. (2025). Pine Script Documentation. Custom indicator programming guide.
- Investopedia. (2025). Technical Analysis Guide. Comprehensive technical analysis education.
- TradingView. (2025). TradingView Guide. Get started with professional charting.
Frequently Asked Questions
- Do I need a paid plan for charting?
- No. You can use TradingView for free. Some limitations exist. The free plan allows one saved layout. Two indicators per chart are included. Paid plans (Essential, Plus, Premium) unlock more indicators. More saved layouts are available. Advanced features are included. Custom alerts are possible. Priority data feeds are provided. Paid plans offer better value for serious traders.
- Can I use TradingView on mobile?
- Yes. The mobile app provides full charting functionality. Touch-optimised controls are included. Your layouts sync across devices. This is very convenient. Advanced users may prefer desktop. Complex analysis works better there. Multiple-monitor setups are helpful. Mobile is great for monitoring. Desktop is better for detailed work.
- Does Trading TradingView support crypto and stocks?
- Yes. TradingView supports a wide range of assets, including crypto, stocks, forex, commodities, bonds, and futures, all on one platform. You can analyse any market with the same tools and interface, making it ideal for diversified traders.
- What are the best indicators for crypto beginners?
- Start with Moving Averages using 50 and 200 periods, add RSI with 14 periods, and include the Volume indicator to provide clear trend direction, obvious momentum signals, and confirmed market interest without overwhelming your chart. You should avoid overusing indicators and keep your analysis simple and focused.
- Which timeframe should I use for crypto trading?
- Beginners should use 4H charts for short-term analysis or 1D charts for swing trading, avoiding 1-minute charts entirely, as they're too noisy and can lead to overtrading. You must align your timeframe with your trading style and available time, starting with the daily charts as recommended.
- Is TradingView data accurate and real-time?
- TradingView provides real-time data from major exchanges with minimal delay, typically under 1 second, though free accounts may have delays, while paid plans offer priority feeds with market depth information. You should verify data quality as your analysis depends on accuracy.
- How many alerts can I set on TradingView?
- Free accounts can set 1 alert; Essential accounts get 20 alerts; Plus gets 100; and Premium accounts have 400, delivered via email, mobile push notifications, or webhooks for automated trading. You should upgrade to receive more alerts and make your trading more efficient.
- Can I share my TradingView charts with others?
- Yes, you can easily share charts via direct links, embed them on websites, publish to TradingView's social platform, and export as images or PDFs for professional presentations and reports. You should share your analysis to grow your reputation in the trading community.
- Does TradingView support strategy backtesting?
- Yes, TradingView includes Pine Script. Create custom indicators easily. Strategies have built-in backtesting. Test strategies on historical data. See performance metrics clearly. Do this before live trading. You must backtest everything first. Your confidence will increase.
Getting Started with TradingView
You should start now to improve your trading skills using TradingView, which we highly recommend. Sign up for TradingView today to build your first professional chart using the world's most powerful charting platform.
You must learn more tools. Your knowledge should expand. Explore our complete guide to crypto tools. Find essential trading resources. Analysis becomes easier.
You should choose exchanges carefully, as your trading success depends on it. Learn about major crypto exchanges to execute your strategies properly.
Financial Disclaimer
This content is not financial advice. All information provided is for educational purposes only. Cryptocurrency investments carry significant investment risk, and past performance does not guarantee future results. Always do your own research and consult a qualified financial advisor before making investment decisions.