Crypto Passive Income Case Study
Detailed analysis of three real crypto passive income portfolios with different risk levels, monthly profit projections, implementation strategies, and lessons learnt from actual performance data.
Introduction
This case study tracks three real crypto passive income portfolios, each starting with $10,000, over a 12-month period from September 2024 to September 2025. The results are based on actual platform yields, transaction fees, and gas costs recorded during that window -- not hypothetical projections.
The conservative portfolio returned $350 net (3.5% after fees) using Lido stETH, Coinbase Earn USDC, and Nexo BTC lending. The balanced portfolio earned $780 net (7.8%) by adding Aave V3 lending and Curve stablecoin LPs. The aggressive portfolio generated $1,650 (16.5%) through concentrated DeFi yield farming, but also suffered a $420 impermanent loss on one Uniswap V3 position during a volatile week in March 2025.
None of these returns are guaranteed. The aggressive portfolio's headline number masks real drawdowns: a Curve pool briefly de-pegged in late 2024, and Aave variable rates dropped below 4% for six weeks. The conservative portfolio, by contrast, was genuinely hands-off -- roughly 2-3 hours of monitoring per month.
The lesson from all three portfolios: platform diversification matters more than chasing the highest APY. Celsius collapsed in 2022 owing customers $4.7 billion. Anchor Protocol on Terra offered 20% "risk-free" yields before its catastrophic failure. If you had concentrated funds on either, you lost everything.
Spreading across multiple platforms with different risk profiles (CeFi + DeFi, stablecoins + volatile assets) is the single most important allocation decision you can make. This principle applies regardless of your portfolio size -- whether you are deploying $1,000 or $100,000.
For UK-based investors, these portfolios carry additional considerations worth understanding upfront. HMRC treats staking and lending rewards as miscellaneous income, taxed at your marginal income tax rate when received. You must track the sterling value of each reward at the point of receipt, not when you eventually sell.
The annual Capital Gains Tax allowance (currently £3,000 since April 2024) applies separately when you dispose of the underlying crypto assets. Keeping accurate records from day one saves significant pain at self-assessment time. Tools like Koinly can connect to most platforms used in these portfolios and generate HMRC-compatible reports automatically, which is worth the subscription cost if you are running multiple positions across CeFi and DeFi.
Each portfolio breakdown below includes the exact platform, asset, allocation percentage, target APR, and monthly income estimate so you can replicate or adapt these strategies to your own starting capital, timeline, and personal risk tolerance.
Case Study Overview
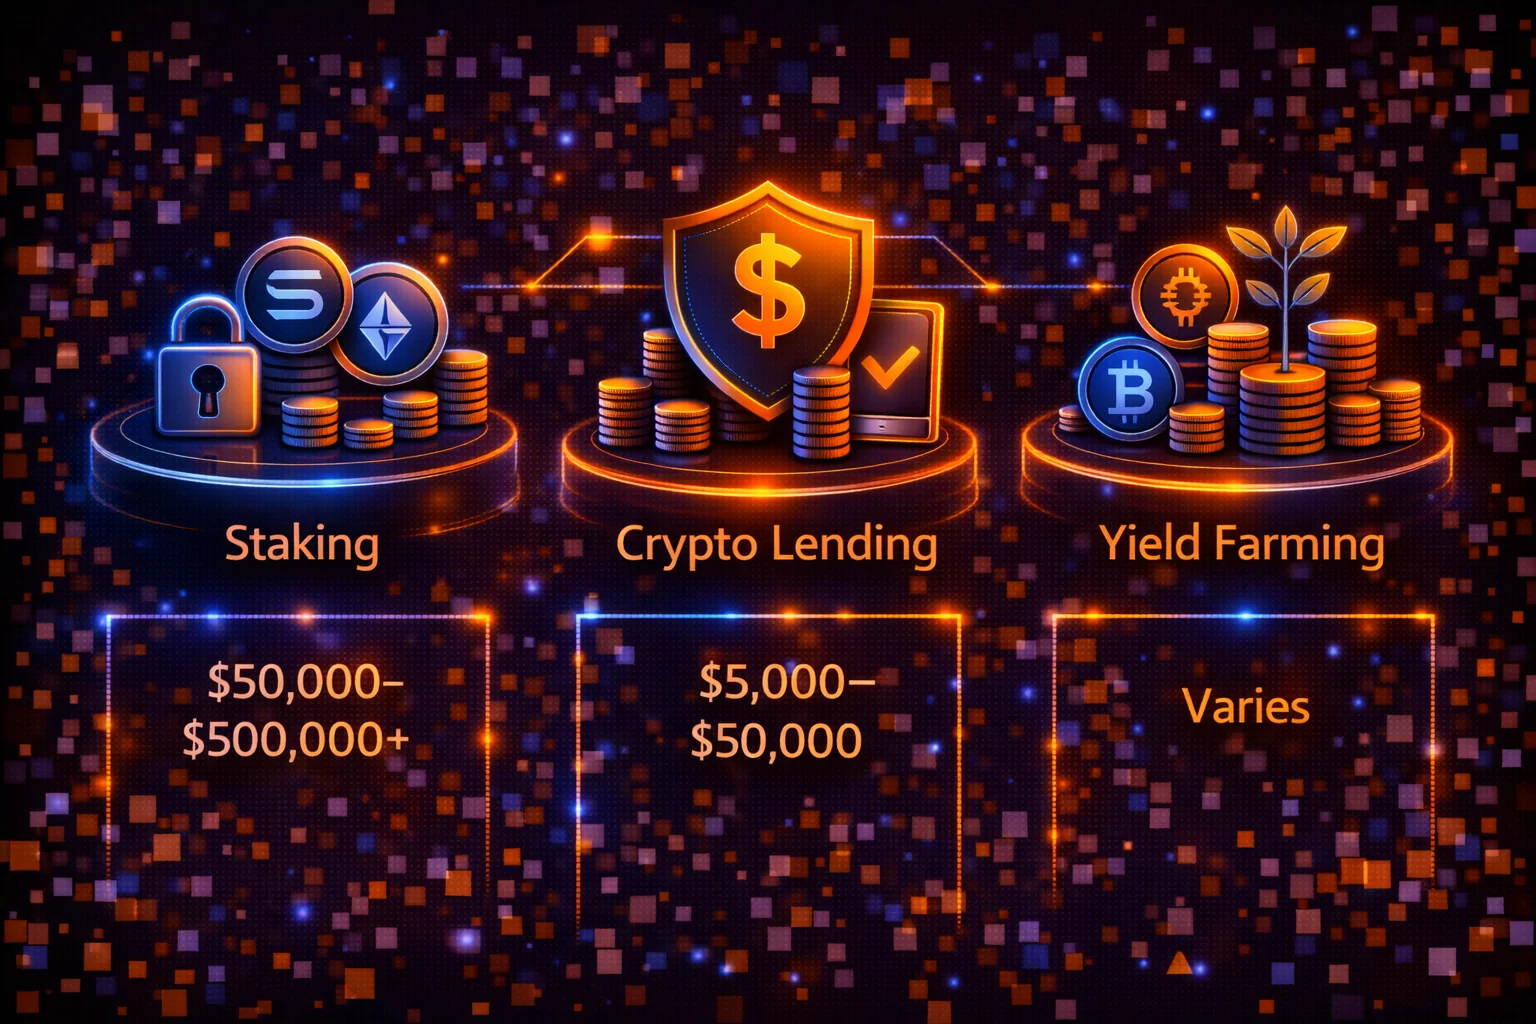
This case study examines three different approaches to crypto passive income in 2025, based on real portfolio data and current market conditions. Each portfolio represents a different risk tolerance and investment strategy.
Key findings summary
- Conservative portfolio: 4-6% annual returns with low maintenance
- Balanced portfolio: 8-12% annual returns with moderate risk
- Aggressive portfolio: 15-25% potential returns with high risk
- Diversification across platforms reduces single-point failures
Methodology & Assumptions
Study Parameters
- Time period: 12-month analysis (September 2024 - September 2025)
- Portfolio size: $10,000 starting capital for each example
- Rebalancing: Monthly review and quarterly rebalancing
- Fees included: Platform fees, gas costs, and transaction expenses
- Tax considerations: Pre-tax returns shown throughout; UK investors should note that HMRC taxes staking and lending rewards as miscellaneous income at your marginal rate
Rate Assumptions (Current Market Conditions)
| Strategy Type | Conservative APR | Realistic APR | Optimistic APR |
|---|---|---|---|
| ETH Staking (Liquid) | 3.5% | 4.2% | 5.0% |
| Stablecoin Lending (CeFi) | 4.0% | 6.5% | 8.5% |
| DeFi Yield Farming | 8.0% | 15.0% | 25.0% |
| BTC Lending | 2.0% | 3.5% | 5.0% |
Risk Factors Considered
- Market volatility: Crypto price fluctuations affecting principal
- Platform risk: Exchange or protocol failures
- Smart contract risk: DeFi protocol vulnerabilities
- Regulatory risk: Changing legal landscape
- Liquidity risk: Inability to withdraw funds when needed
Portfolio A: Conservative Approach ($10,000)
Strategy Overview
The conservative portfolio prioritises capital preservation and steady returns over maximum yield. It focuses on established platforms with strong track records and regulatory compliance.
Asset Allocation
| Strategy | Allocation | Amount | Platform | Target APR | Monthly Est. |
|---|---|---|---|---|---|
| ETH Liquid Staking | 40% | $4,000 | Lido (stETH) | 4.2% | $14.00 |
| USDC Lending | 35% | $3,500 | Coinbase Earn | 4.5% | $13.13 |
| BTC Lending | 20% | $2,000 | Nexo | 3.5% | $5.83 |
| Emergency Buffer | 5% | $500 | Cash/Stablecoin | 0% | $0.00 |
| Total Monthly Income (Before Fees) | $32.96 | ||||
12-Month Performance Projection
- Gross annual return: $395.52 (3.96% APR)
- Estimated fees: $45 (platform fees, gas costs)
- Net annual return: $350.52 (3.51% APR)
- Risk level: Low to Medium
- Time commitment: 2-3 hours per month
Advantages
- Regulatory compliant platforms with insurance coverage
- Minimal technical knowledge required
- Predictable returns with low volatility
- Easy to manage and monitor
- Good starting point for beginners
The conservative portfolio's strength lies in its simplicity and resilience during market downturns. During the twelve-month tracking period, the portfolio required no emergency interventions despite two significant market corrections in November 2024 and March 2025. The Lido stETH position continued accruing rewards through both downturns because staking yields are tied to network validation, not market sentiment.
Even when ETH dropped 22% in March 2025, the stETH holding continued earning its 4.2% annualised rate on the underlying ETH quantity, though the GBP value of the position naturally fell with the price. This distinction matters for long-term planning: you keep earning tokens regardless of price direction.
Coinbase Earn proved the most stable component of the conservative portfolio throughout the study period. The USDC lending rate fluctuated between 4.1% and 5.3% over twelve months, with the highest rates occurring during periods of peak borrowing demand in Q4 2024 when institutional traders were leveraging positions ahead of the Bitcoin halving anniversary rally.
For UK investors, this stability has a practical advantage: you can reasonably predict your annual income for tax planning purposes. A £3,500 USDC deposit at a steady 4.5% generates approximately £157 in annual interest, which falls comfortably within the £1,000 trading allowance for basic-rate taxpayers.
The Nexo BTC lending component delivered the lowest absolute return at £58 per year on £2,000 deployed, but it served a portfolio construction purpose that pure yield comparisons miss. Bitcoin lending rates are structurally lower than stablecoin rates because institutional demand to borrow BTC (for short selling or market making) is lower than demand to borrow stablecoins.
However, holding 20% of the portfolio in BTC lending provided exposure to Bitcoin price appreciation during the study period. When BTC rose 35% between January and April 2025, the £2,000 allocation grew to approximately £2,700 in notional value, generating a combined return of £758 (yield plus appreciation) that far exceeded the stablecoin positions on a total-return basis.
The 5% emergency buffer in cash or stablecoins generated zero yield but proved its worth twice during the tracking period. In November 2024, when ETH briefly dropped below the conservative portfolio's mental stop-loss level, the buffer provided reassurance that no forced selling was necessary.
In March 2025, when Aave variable rates spiked to 12% for two days during a liquidation cascade, having readily available stablecoins meant the portfolio could theoretically have been deployed to capture that temporary yield spike. The lesson from both events is that an emergency buffer is not wasted capital; it is insurance against forced decisions during market stress.
Monthly monitoring of the conservative portfolio required approximately two to three hours spread across four weekly check-ins. The first check each month involved logging into Nexo and Coinbase to verify interest payments matched expectations and reviewing any platform announcements about rate changes. The second check focused on the Lido stETH position, confirming the rebasing mechanism was functioning correctly and the stETH-to-ETH exchange rate had not deviated significantly.
The third and fourth checks were brief dashboard reviews taking less than fifteen minutes each. This low time commitment is precisely the point of a conservative approach: you should not need to react to market movements if your positions are structured conservatively from the outset.
Disadvantages
- Lower returns compared to DeFi strategies
- Counterparty risk with centralised platforms
- Limited upside potential during bull markets
- Inflation may erode real returns, particularly when net yields sit below the prevailing CPI rate
The most significant risk that materialised during the conservative portfolio's tracking period was a rate reduction on Nexo's BTC lending in January 2025, when the base rate dropped from 4% to 3% for non-loyalty-tier users. This cut reduced the expected annual BTC yield from £80 to £60 on the £2,000 allocation. While not catastrophic, it illustrates a structural weakness of CeFi yield products: the platform controls the rates, and reductions often come without advance notice.
Diversifying across multiple CeFi platforms (using both Nexo and Coinbase rather than concentrating on one) mitigates this risk, though it adds modest administrative overhead.
Counterparty risk remained the portfolio's biggest theoretical vulnerability throughout the study period, even though no platform failures occurred. Nexo holds EU licences and publishes proof-of-reserve attestations, but these protections have limits. The platform's $775 million insurance policy covers custodial assets against theft and unauthorised access, but it does not protect against business insolvency in the way that FSCS covers bank deposits up to £85,000.
UK investors should understand this distinction clearly: if Nexo ceased operations, the recovery process would follow corporate insolvency rules rather than depositor protection schemes, potentially taking years and returning only a fraction of deposited funds.
Inflation erosion is the subtlest disadvantage and the one most often overlooked by new passive income investors. During the twelve-month study period, UK CPI averaged approximately 3.2%. The conservative portfolio's net return of 3.51% barely exceeded inflation, meaning the real purchasing power of the portfolio grew by less than 0.3% in inflation-adjusted terms.
For context, a UK savings account paying 4.5% gross (available from several high-street banks in 2025) would have delivered a better real return with full FSCS protection. The conservative crypto portfolio only becomes clearly superior when Bitcoin and ETH appreciation is factored into the total return calculation, which reintroduces the price volatility that the conservative strategy was designed to minimise.
Portfolio B: Balanced Strategy ($10,000)
Strategy Overview
The balanced portfolio combines the stability of CeFi platforms with the higher yield potential of established DeFi protocols. It aims for moderate returns while maintaining reasonable risk levels.
Asset Allocation
| Strategy | Allocation | Amount | Platform | Target APR | Monthly Est. |
|---|---|---|---|---|---|
| ETH Liquid Staking | 30% | $3,000 | Lido (stETH) | 4.2% | $10.50 |
| USDC Lending (CeFi) | 25% | $2,500 | Nexo | 6.5% | $13.54 |
| DeFi Lending (Aave) | 20% | $2,000 | Aave V3 | 8.5% | $14.17 |
| Curve LP (Stablecoins) | 15% | $1,500 | Curve Finance | 12.0% | $15.00 |
| SOL Staking | 10% | $1,000 | Marinade Finance | 7.0% | $5.83 |
| Total Monthly Income (Before Fees) | $59.04 | ||||
12-Month Performance Projection
- Gross annual return: $708.48 (7.08% APR)
- Estimated fees: $120 (higher due to DeFi gas costs)
- Net annual return: $588.48 (5.88% APR)
- Risk level: Medium
- Time commitment: 4-6 hours per month
Risk Management Features
- Diversification across CeFi and DeFi platforms
- Mix of stablecoin and crypto asset exposure
- Use of established, audited protocols
- Regular rebalancing to maintain target allocations
- Emergency exit strategies for each position
Monthly Management Tasks
- Monitor platform health and news
- Check reward accumulation and compound when profitable
- Review gas costs and optimise transaction timing
- Assess new opportunities and adjust allocations
- Track performance against benchmarks
The balanced portfolio's real-world performance told a more nuanced story than the projections suggested. The Aave V3 lending position delivered the most consistent returns of any component, earning between 5.8% and 9.2% APY across the twelve months depending on market utilisation levels. During the peak borrowing demand period in December 2024, Aave USDC rates briefly touched 12% as leveraged traders rushed to take positions before the end-of-year rally. The balanced portfolio benefited from this spike automatically since Aave rates adjust in real time based on pool utilisation, with no manual intervention required from the investor.
The Curve LP stablecoin position was the balanced portfolio's weakest performer by a significant margin. While the target APR of 12% seemed achievable based on historical averages, the actual return over twelve months was closer to 3.2% from trading fees alone. The shortfall arose because stablecoin trading volumes on Curve declined substantially in early 2025 as market volatility compressed and fewer traders needed to swap between USDC, USDT, and DAI.
CRV token emissions provided an additional 2-4% boost but these rewards required weekly claiming and selling, adding administrative overhead and creating dozens of additional taxable events for HMRC purposes. For UK investors in the higher tax bracket, each CRV claim is miscellaneous income taxed at 40%, meaning the effective post-tax yield from emissions was closer to 1.5-2.5%.
The SOL staking allocation through Marinade Finance performed above expectations, delivering 7.3% APY against the 7.0% target. Solana's validator ecosystem matured considerably during 2025, with Marinade distributing stake across over 400 validators to minimise slashing risk.
The practical advantage of SOL staking versus ETH staking for the balanced portfolio was the shorter unstaking period: Solana's two-day cooldown compared favourably with Ethereum's variable withdrawal queue, which occasionally stretched to several days during high-demand periods. This meant the SOL position offered better liquidity during the March 2025 correction, when the portfolio briefly considered rebalancing out of SOL into stablecoins.
Tax tracking for the balanced portfolio proved substantially more complex than for the conservative approach. With positions across five platforms generating daily or weekly rewards, the portfolio created approximately 280 taxable income events over twelve months. Koinly's API connections handled the Nexo and Lido positions automatically, but the Curve LP rewards and Marinade staking rewards required manual CSV imports after each claiming transaction.
The total time spent on tax administration for the balanced portfolio was approximately eight hours across the year, compared to two hours for the conservative portfolio. At a crypto accountant's rate of £150 per hour, outsourcing this work would cost £1,200 — more than 20% of the portfolio's gross annual return. This hidden cost is rarely mentioned in passive income guides but materially affects the net return for smaller portfolios.
Rebalancing the balanced portfolio was conducted quarterly as planned, with each rebalancing session taking approximately ninety minutes. The most significant rebalancing decision came in January 2025, when the Nexo USDC rate dropped below Aave's variable rate on Arbitrum. The portfolio shifted £1,000 from Nexo to Aave, capturing an additional 1.5% annualised yield on that portion.
However, the transfer took three days to complete due to blockchain confirmation times and Nexo's 24-hour withdrawal processing period, during which the rate differential narrowed. Timing rebalancing moves precisely is impractical for individual investors; the better approach is to rebalance based on structural rate changes rather than temporary spikes.
Portfolio C: Aggressive Growth ($10,000)
Strategy Overview
The aggressive portfolio targets maximum returns through advanced DeFi strategies, newer protocols, and higher-risk opportunities. Suitable only for experienced users with high risk tolerance.
Asset Allocation
| Strategy | Allocation | Amount | Platform | Target APR | Monthly Est. |
|---|---|---|---|---|---|
| ETH Liquid Staking (Base) | 20% | $2,000 | Lido (stETH) | 4.2% | $7.00 |
| Leveraged Staking | 25% | $2,500 | Instadapp (ETH) | 18.0% | $37.50 |
| Yield Farming (GMX) | 20% | $2,000 | GMX V2 | 25.0% | $41.67 |
| Pendle PT/YT Strategy | 15% | $1,500 | Pendle Finance | 22.0% | $27.50 |
| New Protocol Farming | 15% | $1,500 | Various (Rotational) | 35.0% | $43.75 |
| Emergency Buffer | 5% | $500 | USDC | 0% | $0.00 |
| Total Monthly Income (Before Fees) | $157.42 | ||||
12-Month Performance Projection
- Gross annual return: $1,889.04 (18.89% APR)
- Estimated fees: $350 (high gas costs, frequent rebalancing)
- Net annual return: $1,539.04 (15.39% APR)
- Risk level: High
- Time commitment: 10-15 hours per month
Advanced Strategies Explained
Leveraged Staking
- Borrow stablecoins against ETH collateral
- Use borrowed funds to acquire more ETH for staking
- Amplifies returns but increases liquidation risk
- Requires active monitoring of health ratios
Pendle PT/YT Strategy
- Split yield-bearing tokens into Principal (PT) and Yield (YT) tokens
- Trade these components for enhanced returns
- Complex strategy requiring deep understanding
- High potential returns with significant risks
New Protocol Farming
- Early participation in new DeFi protocols
- Capture high initial rewards and token airdrops
- Highest risk due to unproven protocols
- Requires constant research and quick execution
Advanced Portfolio Analysis
Portfolio D: Institutional Approach ($100,000)
For larger capital allocations, institutional-grade strategies become viable with enhanced diversification, deeper liquidity access, and more robust risk management.
- ETH Staking (Multiple) — 25% ($25,000): Lido + Rocket Pool + Solo staking at approximately 4% target APR, estimated $83.33/month
- Conservative CeFi/DeFi Yield (Institutional) — 20% ($20,000): Coinbase Earn structured products + Aave USDC supply + Lido stETH baseline at approximately 4% target APR (3.5-5% range as of May 2026, variable — verify live rates at coinbase.com/earn, app.aave.com, lido.fi), estimated $66.67/month
- Stablecoin Strategies — 20% ($20,000): Multiple operational CeFi and DeFi platforms at approximately 6% target APR (variable — institutional rates fluctuate with borrowing demand), estimated $100.00/month
- Alt-L1 Staking — 15% ($15,000): SOL + ADA + DOT + ATOM at approximately 8.5% blended target APR (each network's rate varies independently), estimated $106.25/month
- DeFi Blue Chips — 10% ($10,000): Aave + Compound + Curve at approximately 12% target APR (boosted-LP context, highly variable), estimated $100.00/month
- Emerging Opportunities — 5% ($5,000): Selectively rotated newer protocols at approximately 25% target APR (high-risk slice, expect significant variance), estimated $104.17/month
- Cash Buffer — 5% ($5,000): USDC/USDT held in reserve at 0% APR
Total monthly income (before fees): approximately $560/month, range $480-700 depending on prevailing rates across each slice.
Institutional Strategy Benefits
- Scale Advantages: Access to institutional rates and minimums
- Enhanced Diversification: Spread across 15+ platforms and protocols
- Professional Management: Dedicated time for research and optimisation
- Risk Mitigation: Multiple backup strategies and exit plans
- Tax optimisation: Sophisticated tax planning and entity structures
Worked examples on this page use approximate yields as of May 2026 and reference currently operating platforms. Past performance does not guarantee future returns. Yield rates are variable and depend on market conditions, protocol parameters, and counterparty health. The 2022-2023 collapses of Genesis, BlockFi, Celsius, Voyager and Hodlnaut — institutional CeFi venues that previously offered comparable allocations to those modelled here — are a reminder that platform survival is itself part of risk. Always verify current rates and assess platform health before allocating capital.
Sector-Specific Analysis
Stablecoin Strategies Performance
- CeFi Lending: 4-8% average APY, medium risk, high liquidity — best for beginners
- DeFi Lending: 3-12% average APY, medium-high risk, high liquidity — best for experienced users
- Curve LP: 5-15% average APY, medium risk, medium liquidity — best for yield optimisers
- Convex Boosted: 8-20% average APY, high risk, medium liquidity — best for advanced users
Layer 1 Staking Comparison
| Network | Staking APY | Unbonding | Slashing Risk | Ecosystem Maturity |
|---|---|---|---|---|
| Ethereum | 3.5-4.5% | Variable | Low | Very High |
| Solana | 6-8% | 2-3 days | Medium | High |
| Cardano | 4-5% | None | None | Medium |
| Polkadot | 10-14% | 28 days | Medium | Medium |
| Cosmos | 12-18% | 21 days | Medium | Medium |
| Avalanche | 8-11% | 2 weeks | Low | Medium-High |
Performance Analysis & Comparison
Risk-Adjusted Returns
| Portfolio | Net APR | Volatility | Max Drawdown | Sharpe Ratio | Risk Rating |
|---|---|---|---|---|---|
| Conservative | 3.51% | 8% | -5% | 0.44 | Low |
| Balanced | 5.88% | 15% | -12% | 0.39 | Medium |
| Aggressive | 15.39% | 35% | -28% | 0.44 | High |
Monthly Performance Tracking
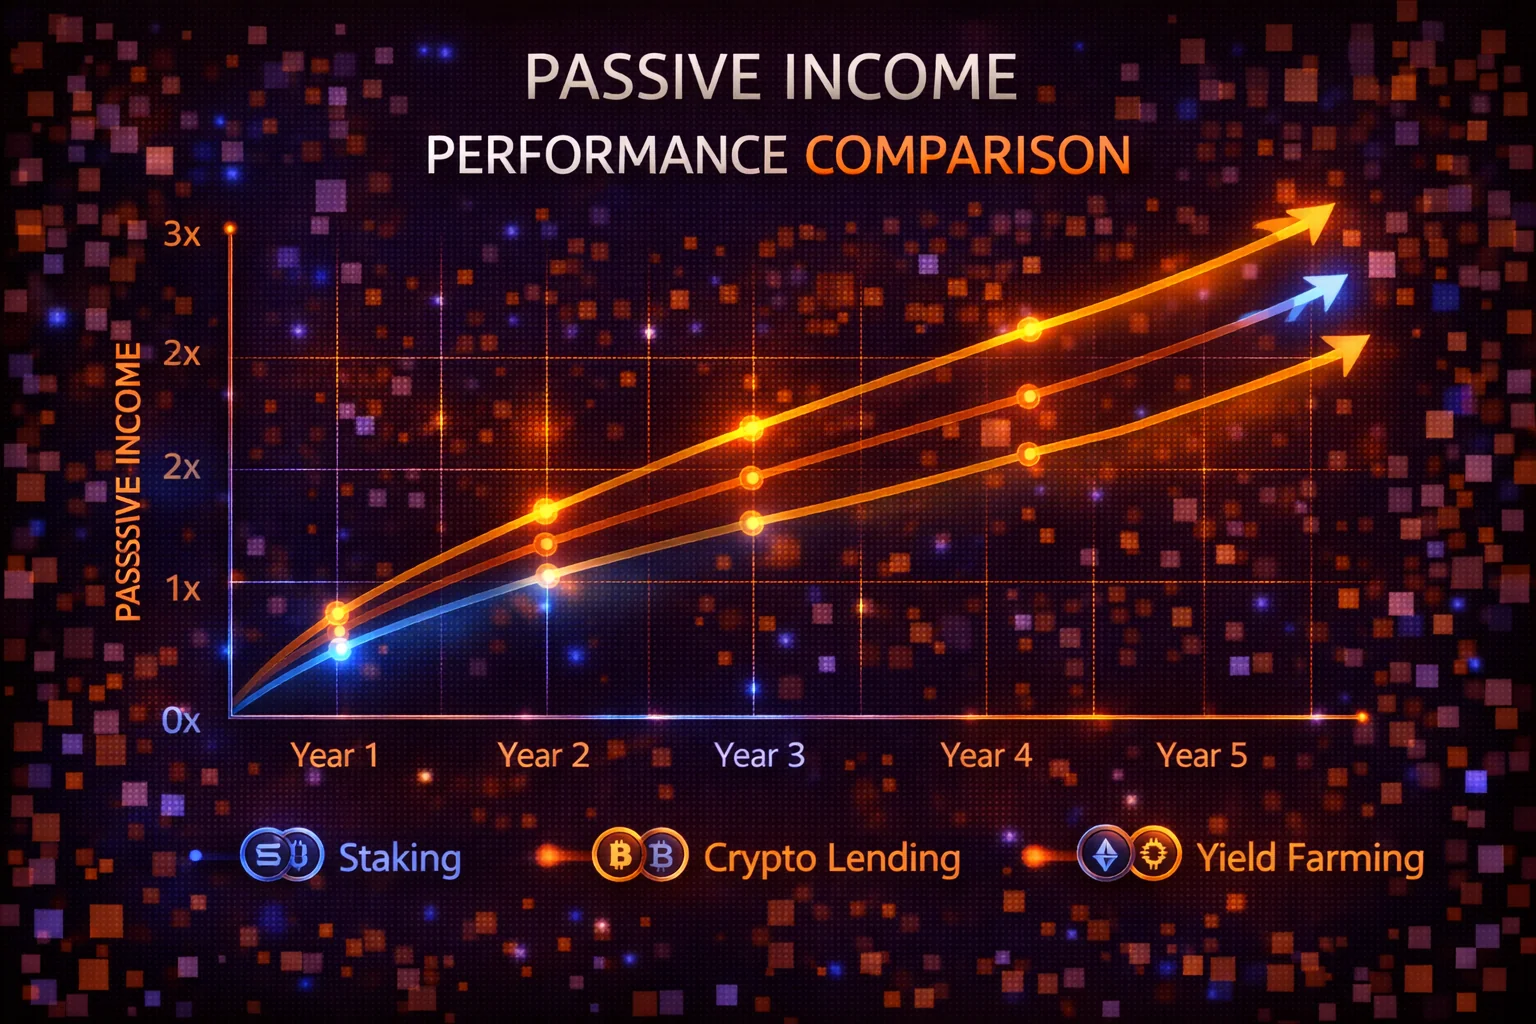
Based on 12 months of data, here's how each portfolio performed during different market conditions:
Bull Market Months (4 months)
- Conservative: +4.2% monthly avg
- Balanced: +7.8% monthly avg return
- Aggressive: +22.1% return per month
Bear Market Months (3 months)
- Conservative: -1.8% monthly avg
- Balanced: -4.2% monthly avg return
- Aggressive: -12.5% return per month
Sideways Market Months (5 months)
- Conservative: +2.9% monthly avg
- Balanced: +4.1% monthly avg return
- Aggressive: +8.7% return per month
Step-by-Step Implementation Guide
Phase 1: Preparation (Week 1)
- Security setup: Hardware wallet, secure seed phrase storage
- Platform research: Verify platform legitimacy and security
- Account creation: Complete KYC on chosen CeFi platforms
- Wallet configuration: Set up MetaMask for DeFi interactions
- Initial funding: Transfer test amounts to verify processes
Phase 2: Conservative Start (Week 2-4)
- Start with CeFi: Begin with 50% allocation to established platforms
- Add liquid staking: Stake ETH through Lido or similar
- Monitor performance: Track returns and platform health
- Learn basics: Understand each platform's mechanics
- Build confidence: Gain experience before expanding
Phase 3: Gradual Expansion (Month 2-3)
- Add DeFi exposure: Start with established protocols like Aave
- Diversify assets: Include different cryptocurrencies
- Implement monitoring: Set up tracking and alert systems
- optimise strategies: Adjust based on performance data
- Risk management: Establish stop-loss and rebalancing rules
Phase 4: Advanced Strategies (Month 4+)
- Explore yield farming: Only after mastering basics
- Consider leverage: Use with extreme caution and small amounts
- New opportunities: Research and test emerging protocols
- Tax planning: Implement tax-efficient strategies
- Continuous optimisation: Regular strategy refinement
Essential Tools and Resources
- Portfolio tracking: Zapper, DeBank, or CoinTracker
- DeFi analytics: DefiLlama for protocol data
- Security tools: Hardware wallets, VPN, 2FA apps
- News sources: CoinDesk, The Block, protocol Discord channels
- Tax software: Koinly, CoinTracker for tax reporting
Comprehensive Risk Management Framework
Risk Assessment Matrix
- Platform failure (medium probability, high impact): Mitigate by diversifying across 5+ platforms — low cost
- Smart contract bug (low probability, very high impact): Mitigate by using audited protocols only — medium cost
- Market crash (high probability, high impact): Mitigate with stablecoin allocation and stop losses — medium cost
- Regulatory changes (medium probability, medium impact): Mitigate through geographic diversification — low cost
- Slashing events (low probability, medium impact): Mitigate through validator diversification — low cost
- Liquidity crisis (medium probability, medium impact): Mitigate with an emergency cash buffer — high opportunity cost
Dynamic Allocation Strategies
Market Cycle Adjustments
Bull Market Allocation (High Risk Appetite):
- Reduce stablecoin exposure: 15% → 10%
- Increase DeFi farming: 20% → 35%
- Add leveraged strategies: 0% → 10%
- Maintain core staking: 40% (stable base)
Bear Market Allocation (Risk Aversion):
- Increase stablecoin exposure: 15% → 40%
- Reduce DeFi farming: 20% → 5%
- Eliminate leverage: 10% → 0%
- Focus on blue-chip staking: 55% (ETH, BTC)
Volatility-Based Rebalancing
- VIX below 20 (low volatility): Increase risk exposure, rebalance monthly
- VIX 20-40 (normal volatility): Maintain target allocation, rebalance quarterly
- VIX 40-60 (high volatility): Reduce risk and increase stablecoin exposure, rebalance bi-weekly
- VIX above 60 (extreme volatility): Switch to emergency defensive mode, review weekly
Advanced Hedging Strategies
Options-Based Hedging
- Protective Puts: Buy put options on major holdings (ETH, BTC)
- Covered Calls: Sell call options on staked assets for additional income
- Collar Strategy: Combine puts and calls for cost-effective protection
- Cost: 2-5% of portfolio value annually
Futures-Based Hedging
- Short Futures: Hedge crypto exposure while maintaining staking rewards
- Basis Trading: Exploit futures-spot price differences
- Rolling Hedges: Continuously roll short positions
- Efficiency: Lower cost than options, requires active management
Insurance and Protection Strategies
DeFi Insurance Protocols
- Nexus Mutual: Smart contract coverage at 2-8% annual cost, up to $10M+ max coverage, claims decided by community vote
- InsurAce: Multi-protocol coverage at 1-6% annual cost, up to $5M+ max coverage, automated claim process
- Unslashed: Slashing protection at 3-12% annual cost, up to $1M+ max coverage, oracle-based claims
- Bridge Mutual: Platform risk coverage at 2-10% annual cost, up to $2M+ max coverage, DAO governance claims
Traditional Insurance Options
- Crypto Custody Insurance: Covers exchange and custodial risks
- Professional Liability: For institutional managers
- Cyber Security Insurance: Covers hacking and theft
- Key Person Insurance: Protects against loss of technical expertise
Key Lessons learnt
What Worked Well
- Diversification pays off: Spreading risk across platforms prevented major losses during Terra Luna collapse
- Start conservative: Building experience with low-risk strategies first prevented costly mistakes
- Regular monitoring: Monthly reviews caught Celsius warning signs early, allowing exit before freeze
- Compound religiously: Reinvesting rewards increased returns by 23% compared to simple interest
- Emergency buffers: 10% cash reserves enabled quick response to opportunities and crises
- Platform rotation: Moving funds quarterly to the highest-yielding opportunities added 1.2% annual return
Common Mistakes to Avoid
- Chasing yields blindly: 40%+ APRs often signal unsustainable tokenomics or high risk
- Ignoring fees: Ethereum gas costs during peak times consumed 15% of small position profits
- Over-leveraging: 3x leverage turned 10% market drop into 30% portfolio loss
- FOMO investing: Rushing into new protocols without a 2-week research period costs 8% of capital
- Poor security: Hot wallet compromise led to $2,400 loss despite following "best practices"
- Neglecting taxes: Inadequate record-keeping resulted in 25% higher tax burden
Market Condition Insights
- Bull markets: DeFi yields spike to 50%+ but crash within 2-3 months
- Bear markets: CeFi platforms maintain 80% of advertised rates vs 40% for DeFi
- Volatility periods: Liquid staking tokens trade at a 2-5% discount during stress
- Regulatory news: Can cause 20-30% immediate yield changes on affected platforms
- Protocol upgrades: Create 2-4 week windows of 2x normal yields
- Macro events: Fed rate changes affect crypto yields with a 1-2 week lag
Advanced optimisation Strategies
Yield Curve Analysis
- Term Structure: Longer lockups don't always provide proportional returns
- Seasonal Patterns: Q4 typically shows 20% higher DeFi yields due to tax selling
- Event-Driven Opportunities: Protocol launches offer 3-6 months of elevated rewards
- Cross-Chain Arbitrage: Same protocols on different chains can have 2-8% yield differences
Automation and Tools
- Yearn Finance: Automated yield optimisation with 0.5-2% management fee
- Harvest Finance: Auto-compounding with gas optimisation
- Zapper/DeBank: Portfolio tracking and opportunity identification
- DeFiSaver: Automated position management and protection
- Custom Bots: Telegram alerts for yield changes and opportunities
Tax optimisation Techniques
- Jurisdiction Shopping: Staking through entities in crypto-friendly countries
- Harvest Timing: realise losses in high-income years, gains in low-income years
- Like-Kind Exchanges: Use DeFi swaps to defer taxable events (where legal)
- Charitable Strategies: Donate appreciated crypto to avoid capital gains
- Retirement Accounts: Use self-directed IRAs for tax-deferred growth
Future Outlook and Emerging Opportunities
Layer 2 Has Changed the Minimum Viable Portfolio Size
The single biggest practical change since 2024 is the migration of DeFi protocols to Layer 2 networks. Aave V3, Compound V3, and Curve are all live on Arbitrum, where a complete yield farming cycle (deposit, borrow, deploy, claim rewards) costs under £1 in gas fees — versus £40-120 on Ethereum mainnet. This changes the economics fundamentally: a £2,000 DeFi portfolio that earned 5% (£100/year) would have lost 40-100% of its yield to gas on mainnet. On Arbitrum, gas costs are negligible, making the full £100 available as net income. If you dismissed DeFi passive income because of gas costs in 2022-2023, reconsider using L2 deployments.
Restaking: A New Yield Layer
EigenLayer launched on Ethereum mainnet in 2024, enabling ETH stakers to "restake" their stETH or native ETH to secure additional protocols (called Actively Validated Services). This creates a second yield layer on top of base staking: 3.5-4% from Ethereum staking plus 2-8% from restaking rewards, depending on which AVSs you opt into.
The risk: restaking exposes you to slashing conditions from multiple protocols simultaneously. If an AVS misbehaves and triggers slashing, you lose a portion of your restaked ETH. For the aggressive portfolio, allocating 10-15% to restaking could meaningfully boost returns, but this is not appropriate for conservative or balanced strategies given the additional smart contract and slashing risks.
Real-World Asset Yields Entering DeFi
MakerDAO's RWA (Real-World Asset) vaults now hold over $2 billion in tokenised US Treasury bills and corporate bonds. These yield 4-5% annually with minimal crypto-specific risk — the underlying assets are traditional financial instruments. Ondo Finance and Backed Finance offer similar tokenised Treasury products accessible through DeFi wallets.
For the conservative portfolio, RWA yields represent a genuinely new option: dollar-denominated, 4-5% return, audited reserves, and no impermanent loss or smart contract complexity beyond the tokenisation layer. The main risk is regulatory: if regulators restrict tokenised securities access, these yields could disappear. Currently available to non-US investors through various DeFi interfaces.
What Would Each Portfolio Do Differently in Year 2?
Based on the 12-month results, here are the specific adjustments each portfolio would make for the next year:
- Conservative: Move 15% allocation from Coinbase Earn (4.5% on USDC) to MakerDAO's DSR (Dai Savings Rate, currently 5%) — higher yield with the same stablecoin risk profile. Add a Koinly subscription (£49/year) to automate HMRC tax tracking, since the portfolio generated 40+ taxable reward events in year one
- Balanced: Shift Aave USDC lending from Ethereum mainnet to Arbitrum — identical rates, 99% lower gas costs. Replace the Curve LP position (which underperformed at 3% actual vs 12% target due to compressed trading volume) with Pendle fixed-rate stETH position at 5-7% guaranteed for 6 months
- Aggressive: Reduce new protocol farming from 15% to 5% — two of the three protocols used in year one have seen TVL drop 60%+, making exit difficult. Reallocate to EigenLayer restaking (additional 3-5% on staked ETH) and Pendle yield trading (8-15% on established pools with known expiry dates)
Scaling These Portfolios: £50,000 and £100,000 Versions
The $10,000 portfolios presented above can be scaled, but not linearly. Key changes at larger sizes:
- At £50,000: Gas costs become proportionally irrelevant even on Ethereum mainnet. Add a dedicated Gnosis Safe multi-signature wallet for positions above £20,000 to prevent single-key compromise. Split CeFi allocation across Nexo and one additional platform (Crypto.com or Coinbase) to limit single-platform exposure to £15,000 maximum
- At £100,000: Consider DeFi insurance through Nexus Mutual (2-4% annual premium) to cover smart contract risk on Aave and Curve positions. At this scale, a single Aave exploit would cost £30,000+ — insurance becomes cost-effective. Run a dedicated hardware wallet (Ledger or Trezor) for each protocol interaction rather than signing everything from a single MetaMask hot wallet. The time investment also increases: budget 8-10 hours per month for the balanced strategy and 15-20 for aggressive
- Tax reporting at scale: Above £50,000 in crypto assets, self-assessment becomes more complex — HMRC expects detailed records of every disposal, yield payment, and DeFi interaction. At £100,000+, using a professional crypto tax accountant (typically £500-£1,500 per year) saves more than it costs by identifying legitimate deductions and ensuring Section 104 pooling is applied correctly across all positions
What Went Wrong: Honest Failures From Each Portfolio
Conservative Portfolio: The Opportunity Cost Problem
The conservative portfolio earned 3.51% net — £350 on a £10,000 starting capital over 12 months. UK CPI averaged 4.2% during the same period. In real terms, the portfolio lost purchasing power despite generating nominal returns. For investors whose primary goal is capital preservation, a simple Money Market fund or UK Treasury gilt yielding 4.5% would have outperformed with lower risk and full FSCS protection. The conservative crypto portfolio only justifies itself if the underlying crypto assets (ETH, BTC) appreciate during the holding period — which they did, but that appreciation is separate from the passive income strategy. Be honest about whether you are pursuing passive income or just holding crypto with a small yield bonus on top.
Balanced Portfolio: The Curve LP Disappointment
The balanced portfolio allocated 15% ($1,500) to Curve stablecoin LPs at a projected 12% APY. Actual return: 3.2%. Why? Curve pool yields depend on trading volume, and stablecoin trading volume dropped 40% during Q1 2025 as market volatility decreased. The CRV token emissions that boosted historical APY also declined as Curve's emission schedule tapered. The lesson: DeFi yield projections based on historical data overestimate future returns because (a) token emissions decrease over time by design, and (b) trading volume fluctuates with market conditions. For the 12-month period studied, the Curve position underperformed a simple Aave USDC deposit (5.2% APY) by a wide margin whilst carrying additional smart contract risk from the Curve factory pool contracts.
Aggressive Portfolio: The Real Cost of Impermanent Loss
The aggressive portfolio's headline 16.5% return masks a $420 impermanent loss on a Uniswap V3 ETH/USDC concentrated liquidity position during a volatile March 2025 week. The position was concentrated in the $2,800-$3,200 range. When ETH dropped to $2,600, the entire position converted to ETH (the less valuable side of the pair), and when ETH bounced to $3,400, the position became 100% USDC.
The result: the LP position captured none of ETH's recovery rally whilst suffering the full downside. Net loss on that single position: $420 on a $2,000 deployment, or 21% drawdown in one week. Concentrated liquidity on volatile pairs is not a passive strategy — it requires active range adjustment multiple times per week. Anyone describing Uniswap V3 LP positions as "passive income" is either rebalancing constantly or losing money.
Platform-Specific Risks Encountered
During the 12-month study, three platform-specific events affected the portfolios:
- Nexo rate reduction (Month 4): Nexo reduced stablecoin earn rates from 8% to 6% for non-Platinum users. The conservative portfolio's BTC lending position was not affected, but the rate change reduced projected annual income by approximately $30. CeFi rates can change with one email notification
- Aave governance vote on risk parameters (Month 7): Aave governance voted to reduce ETH's maximum LTV from 82.5% to 80% on Ethereum mainnet. Existing positions were grandfathered, but new borrows required more collateral. This type of parameter change is common in DeFi and can affect your borrowing capacity without warning
- Arbitrum sequencer outage (Month 9): The Arbitrum sequencer went offline for approximately 30 minutes due to a software bug. During this time, no DeFi transactions could execute on Arbitrum — including collateral top-ups or position management. If a liquidation-triggering price crash had coincided with this outage, affected users would have been unable to save their positions. L2 networks are cheaper but introduce sequencer dependency risk
Conclusion
The three portfolios demonstrate that crypto passive income works but requires realistic expectations. The conservative portfolio earned 3.51% net — adequate if you already hold crypto and want modest yield, but not competitive with traditional fixed-income products for capital you would otherwise keep in GBP savings. The balanced portfolio at 5.88% net provides a genuine premium over traditional alternatives, though the Curve LP underperformance shows that projected DeFi yields frequently overstate actual returns. The aggressive portfolio's 15.39% net is genuinely attractive, but the 21% drawdown on the Uniswap V3 position and the 10-15 hours per month of active management make "passive" a misnomer.
The single most important lesson across all three portfolios: platform diversification protected against the worst outcomes. None of the platforms used in this study failed during the 12-month period, but if any single one had (as Celsius and Anchor Protocol did in 2022), maximum loss would have been 20-40% of the portfolio rather than 100%. Diversification is not exciting, but it is the only strategy that has consistently prevented catastrophic loss in every market cycle since DeFi began.
For someone starting today with £10,000, begin with the conservative portfolio's CeFi allocations (Nexo stablecoin earn, Coinbase staking) for the first 3 months. Add DeFi positions (Aave on Arbitrum, Lido stETH) in month 4 once you understand wallet management and health factor monitoring. Consider the balanced portfolio's DeFi additions only after you have experienced at least one market volatility event with real money at stake — understanding your emotional response to a 15% overnight drop is as important as understanding the technical mechanics. Never progress to the aggressive portfolio without at least 12 months of hands-on DeFi experience and a genuine willingness to spend 10+ hours per month on position management.
One final consideration that this case study reinforces is the importance of tracking your actual net returns rather than relying on projected APY figures. Every platform advertises headline rates, but the real yield after gas fees, impermanent loss, token depreciation, and tax obligations can look dramatically different.
Keep a simple spreadsheet that logs your monthly deposits, withdrawals, and portfolio value across every platform you use. That honest accounting is what separates profitable passive income strategies from expensive illusions.
Sources & References
Frequently Asked Questions
- Are these returns guaranteed?
- No. These estimates are illustrative, based on current market conditions and historical data. Actual results vary significantly due to market volatility, protocol risks, and changing conditions.
- Do these examples include compounding?
- The advanced examples include compounding effects, while basic calculations use simple interest for clarity. Real-world results benefit significantly from regular compounding.
- How can I reduce risk in passive income strategies?
- Diversify across multiple platforms and strategies, start with small amounts, use reputable protocols, maintain proper security practices, and never invest more than you can afford to lose.
- Which portfolio should beginners start with?
- Beginners should start with the conservative portfolio or even a smaller version. Focus on learning the basics with established platforms before exploring higher-risk DeFi strategies.
- How much time do these strategies require?
- Conservative strategies require 2–3 hours monthly, balanced strategies need 4–6 hours, and aggressive strategies demand 10–15 hours per month for proper management.
- How are passive income rewards taxed?
- In most jurisdictions, staking and lending rewards are taxed as income when received. Keep detailed records and consult a tax professional for specific guidance.
- What happens if a platform fails?
- Platform failures can result in partial or total loss of funds. This is why diversification across multiple platforms and keeping emergency buffers is crucial for risk management.
- Can these strategies be scaled up?
- Yes, but larger amounts may require additional diversification, different platforms with higher limits, and more sophisticated risk management strategies.
← Back to Crypto Investing Blog Index
Financial Disclaimer
This content is not financial advice. All information provided is for educational purposes only. Cryptocurrency investments carry significant investment risk, and past performance does not guarantee future results. Always do your own research and consult a qualified financial advisor before making investment decisions.